Abstract
Several gaseous chemical species may lead to adverse health effects and, therefore, several of those are regulated. Brief descriptions of those chemical species, including their major sources and atmospheric fate, are presented. Next, the focus of this chapter is on urban and regional pollution, since it corresponds to most of the population exposure to ambient air pollution. The gaseous pollutants that are currently the most relevant at the urban/regional scale in terms of adverse health effects are ozone and nitrogen dioxide. These pollutants are major components of photochemical smog, which results from chemical reactions between nitrogen oxides (NOx) and volatile organic compounds (VOC) in the presence of sunlight. The fact that photochemical smog precursors such as NOx and some VOC (alkenes) are both producers and destructors of ozone makes the development of efficient strategies to reduce photochemical smog difficult.
Several gaseous chemical species may lead to adverse health effects and, therefore, several of those are regulated. Brief descriptions of those chemical species, including their major sources and atmospheric fate, are presented. Next, the focus of this chapter is on urban and regional pollution, since it corresponds to most of the population exposure to ambient air pollution. The gaseous pollutants that are currently the most relevant at the urban/regional scale in terms of adverse health effects are ozone and nitrogen dioxide. These pollutants are major components of photochemical smog, which results from chemical reactions between nitrogen oxides (NOx) and volatile organic compounds (VOC) in the presence of sunlight. The fact that photochemical smog precursors such as NOx and some VOC (alkenes) are both producers and destructors of ozone makes the development of efficient strategies to reduce photochemical smog difficult. Therefore, this chapter addresses gaseous air pollutants with a focus on the complex processes leading to the formation of photochemical smog. Following a presentation of the main reactions that govern the formation of ozone, nitrogen dioxide, and other gaseous pollutants, the different chemical regimes are analyzed in order to understand how efficient approaches to reduce the concentrations of the main constituents of photochemical smog can be developed.
8.1 General Considerations on Gaseous Pollutants
Gaseous pollutants include primary pollutants, secondary pollutants, and precursors of secondary pollutants. Some chemical species may belong to more than one category. The main gaseous pollutants that are regulated or are precursors of regulated pollutants are briefly presented in the following sections.
8.1.1 Sulfur Dioxide
Sulfur dioxide (SO2) is a primary pollutant. SO2 is the main pollutant of air pollution episodes such as that of 1952 in London. It is regulated because it leads to respiratory problems. As a primary pollutant, its impacts occur near its sources. In North America and Europe, those impacts are now mostly limited to some industrial sites and maritime traffic, because sulfur content in fuels used by road traffic is now regulated.
SO2 is oxidized to sulfuric acid in the atmosphere (see Chapter 10). Sulfuric acid contributes to fine particle air pollution, because its low volatility implies that it is preferentially present in the particulate phase, typically as ammonium salts. In addition, sulfuric acid is an important component of acid rain. SO2 is slightly soluble in water, and it may be removed from the atmosphere by dry and wet deposition.
8.1.2 Carbon Monoxide
Carbon monoxide (CO) is an inorganic carbonaceous compound, because it does not contain any hydrogen atoms. CO is regulated because it combines with hemoglobin in the blood stream and leads to anoxia (lack of oxygen), when the blood stream cannot carry enough oxygen. CO is a primary pollutant, which is mostly emitted by combustion processes, including internal combustion engines. Historically, CO concentrations were, therefore, high near roadways. CO was the first pollutant to be regulated for road traffic in North America and Europe, using catalytic converters, which convert it to carbon dioxide, CO2 (see Chapter 2). Consequently, ambient concentrations of CO are now fairly low in these regions.
CO is oxidized slowly to CO2 in the atmosphere. Its oxidation, which is described in Section 8.3.3, leads also to the formation of ozone, the main gaseous pollutant of photochemical smog. However, the contribution of CO to photochemical air pollution is less than that of other carbonaceous compounds because of its low chemical reactivity and the fact that its emissions are currently regulated.
8.1.3 Ozone and Gaseous Photochemical Oxidants
Photochemical pollution is generally called “photochemical smog.” Smog is the contraction of smoke and fog, because its appearance falls between these two phenomena. Photochemical pollution was initially identified in the Los Angeles Basin in the 1950s. Heavy pollution was present in that region of southern California, because of a large number of anthropogenic pollution sources, such as road traffic, fossil-fuel fired power plants, refineries, and other industrial sources, as well as meteorological conditions that were conducive to air pollution (strong sunlight and low atmospheric dispersion). Arie Haagen-Smit, a biochemistry professor at the California Institute of Technology (Caltech), was the first to identify the processes that lead to the formation of photochemical air pollution, and in particular ozone (O3), which is its main gaseous pollutant. He showed that photochemical air pollution results from atmospheric chemical reactions occurring among precursor gases that include nitrogen oxides (NOx) and volatile organic compounds (VOC), in the presence of sunlight. Hence, the adjective “photochemical” was attributed to that form of air pollution, since photolytic reactions induced by sunlight (see Chapter 7) initiate the set of photochemical reactions that lead to ozone formation.
Ozone is not emitted in the atmosphere and is, therefore, a secondary air pollutant. Its precursors are NOx, VOC, and, to a lesser extent, CO. Although O3 is not the only photochemical oxidant, it is the main gaseous constituent of photochemical smog in terms of ambient concentrations. Therefore, O3 is targeted for regulations pertaining to the gaseous fraction of photochemical smog. Since O3 is produced by photochemical reactions, its concentrations are highest during spring and summer.
8.1.4 Nitrogen Oxides
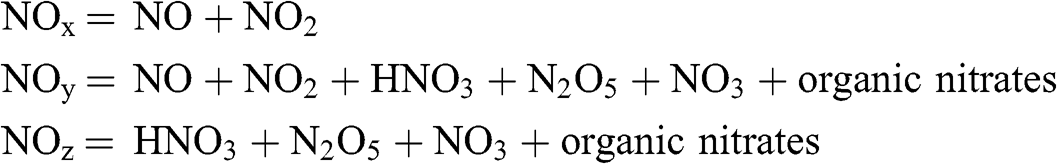
NOx include by definition nitric oxide (NO) and nitrogen dioxide (NO2). Their emissions result mostly from combustion processes. These two compounds represent in terms of ambient concentrations the majority of nitrogen oxides present in the urban atmosphere. However, there are other nitrogen oxides, such as nitrogen protoxide (N2O), which is a greenhouse gas, nitric acid (HNO3), nitrogen pentoxide (N2O5), the nitrate radical (NO3), and a large number of organic nitrates. By convention, NOy represent all nitrogen oxides, with the exception of N2O, and NOz represent the difference between NOy and NOx. Thus, in summary:
NO2 is the only nitrogen oxide that is regulated in terms of its ambient concentrations. It leads to respiratory problems. NO2 is both a primary and a secondary pollutant, because (1) it constitutes a fraction of NOx emissions and (2) it is a product of the atmospheric oxidation of NO.
NOx are rapidly oxidized in the atmosphere. They are precursors of a large number of secondary pollutants, such as ozone, nitric acid, and organic nitrates. Nitric acid may contribute significantly to secondary particulate matter formation. It is also a major constituent of acid rain. Some organic nitrates contribute to the secondary fraction of organic particulate matter. In addition, inorganic and organic nitrates play a major role in the eutrophication of ecosystems.
8.1.5 Volatile and Semi-volatile Organic Compounds
Volatile organic compounds (VOC) and semi-volatile organic compounds (SVOC) are mostly emitted from combustion processes and also from the evaporation of liquid fuels and some organic-containing products (e.g., some paints, solvents, and cleaning products). They play a major role in the formation of photochemical smog. VOC are precursors of ozone. SVOC and some VOC are also important precursors of the secondary fraction of fine particulate matter. In addition, some VOC, such as benzene, 1,3-butadiene, and formaldehyde, are carcinogenic. These carcinogenic VOC may be regulated individually as such (as it is the case in Europe for benzene) or may be regulated indirectly via regulatory approaches that target carcinogenic compounds as a whole (as it is the case in the United States).
VOC include mostly alkanes (hydrocarbons with only single bonds, also called paraffins), alkenes (hydrocarbons with one or more double bonds, also called olefins), aromatic compounds (compounds with one or more phenyl rings), and aldehydes (compounds with a carbonyl group, HC=O). Alcohols (compounds with a C-OH group), alkynes (hydrocarbons with a triple bond), ethers (compounds with a C-O-C group), and other organic compounds are typically present in the atmosphere to a lesser extent. However, alcohols are becoming more prominent due to the use of biofuels and their increased use in gasoline.
The term hydrocarbon (HC) refers to organic compounds that contain only carbon and hydrogen atoms (therefore, alkanes, alkenes, alkynes, and some aromatic compounds). We will use hereafter the term VOC to refer to all organic compounds, thus including aldehydes and alcohols. Among the alkanes, methane has a very low atmospheric reactivity (atmospheric lifetime on the order of 10 years) and, therefore, it is typically not included among the precursors of photochemical air pollution. Thus, when referring to VOC that are precursors of photochemical pollution, one should use the term non-methane VOC. However, for the sake of simplicity, we will use the term VOC to mean non-methane VOC hereafter.
SVOC are organic compounds with a saturation vapor pressure that is such that they can be present in the atmosphere in both the gas phase and the particulate phase. They play a major role in the formation of particulate organic compounds and may also be involved in the formation of gaseous air pollutants.
The ultimate chemical fate of VOC and SVOC is CO2, via atmospheric oxidation. However, organic compounds may be removed from the atmosphere before being converted to CO or CO2. Their removal may occur either as gaseous or particulate compounds, via dry and wet deposition.
8.1.6 Ammonia
Ammonia (NH3) is the reduced form of nitrogen in the atmosphere. It is mostly emitted by agricultural activities. NH3 does not present any adverse health effects at the ambient concentrations usually observed in the atmosphere. However, it contributes to the formation of sulfate and nitrate ammonium salts, which may constitute a significant fraction of fine particulate matter. In addition, NH3 contributes to nitrogen deposition and, therefore, may lead to the eutrophication of ecosystems.
8.2 Oxidizing Power of the Atmosphere and Chemical Reactivity
The atmosphere is an oxidizing environment because of the presence of 21 % of oxygen. However, oxygen is not the main oxidizing species in the atmosphere and atmospheric oxidation processes are due mostly to other chemical species that contain oxygen atoms and are formed photochemically in the atmosphere. The main atmospheric oxidants are:
Their formation in the atmosphere is described in Section 8.3, along with the chemistry of photochemical air pollution.
The oxidation of chemical species, such as VOC, NOx, CO, and SO2 by these oxidants can occur more or less rapidly depending on the oxidant concentrations and the reactivity of the chemical species toward those oxidants. For a given chemical reaction, two terms are generally used to characterize this chemical reactivity:
– The half-life
– The lifetime (also called residence time)
In the case of a reaction with a constant oxidant concentration, the half-life corresponds to the median of the times needed for all the individual molecules of the chemical species initially present to react. The lifetime corresponds to the mean of those reaction times.
The half-life, t½, is the time needed for half of the molecules initially present to react. Let [X]0 be the initial concentration of chemical species X, which here will be oxidized by OH (with a constant concentration), as an example:
The change with time of the concentration of X is given by the following equation (see Chapter 7):
 (8.1)
(8.1) where k is the rate constant of the chemical reaction. Integrating this equation between times 0 and t leads to the following solution:
where [X]0 is the initial concentration, i.e., at t = 0. Therefore, when:
 (8.3)
(8.3) Thus, the half-life of X is:
 (8.4)
(8.4) where ln is the natural logarithm. The lifetime, tl, is the characteristic time of the chemical reaction and is, therefore, defined simply via a dimensional analysis as:
 (8.5)
(8.5) It can be shown that tl corresponds to the mean of the reaction times of all X molecules initially present. Let p(t) be the normalized distribution of the individual reaction times of all X molecules (some will react right away or almost right away, whereas others will react after a long, or very long, time). Since all molecules have the same probability of reacting, the number of molecules that will react is proportional to the concentration of these molecules and, by definition, this function, p(t), is proportional to the concentration of X molecules:
This function is normalized and its integration over time must be equal to 1. Therefore, the pre-exponential factor is calculated to be equal to (k [OH]):
The mean of the reaction times of all X molecules can be obtained by integrating the reaction time weighted by the distribution of those reaction times:
 (8.8)
(8.8) Integrating by parts:
 (8.9)
(8.9) The half-life is related to the lifetime (i.e., mean reaction time) as follows:
If the chemical species X undergoes several oxidation reactions, its overall half-life and overall lifetime can be calculated by considering all the oxidation reactions. For example, if X is oxidized by OH, NO3, and O3:
 (8.11)
 where kOH, kNO3, and kO3 are the rate constants of the different oxidation reactions. Integrating this equation leads to the following solution:
 (8.12)
 The half-life and the lifetime are, respectively, as follows:
 (8.13)
 The overall half-life and lifetime can be expressed in terms of the half-lives and lifetimes of the individual reactions:
 (8.14)
 The lifetimes and half-lives of the main atmospheric pollutants vary greatly, ranging from a few hours for species such as NOx and propane (C3H8) to about 10 years for methane. The chemical reactivity of VOC is related to their ozone formation potential as discussed in Section 8.5.3. Table 8.1 lists typical atmospheric chemical lifetimes of selected chemical species undergoing oxidation by OH, NO3, and O3, as well as photolysis.
Table 8.1. Lifetimes of selected chemical species in the atmosphere at 1 atm and 25 °C for various oxidation reactions and photolysis. Sources of the rate constants: Calvert et al., 2000, 2002, 2008, 2011; Finlayson-Pitts and Pitts, 2000; Mollner et al., 2010.
| Chemical species | Photolysisa | OHa | NO3a | O3a |
|---|---|---|---|---|
| NO2 | (b) | 30 h | (b) | (b) |
| SO2 | – | 12 d | – | – |
| CO | – | 48 d | – | – |
| Methanec | – | 5 a | >300 a | – |
| Propane | – | 11 d | >4 a | – |
| n-Butane | – | 5 d | 7 a | – |
| Hexane | – | 2 d | 3 a | – |
| Octane | – | 36 h | 20 mo | – |
| Ethylene | – | 33 h | 19 mo | 7 d |
| Propylene | – | 11 h | 12 d | 28 h |
| trans-2-Butene | – | 4 h | 7 h | 90 min |
| 1,3-Butadiene | – | 4 h | 28 h | 44 h |
| 1-Hexene | – | 8 h | (d) | 25 h |
| trans-3-Hexene | – | (d) | (d) | 100 min |
| trans-4-Octene | – | 4 h | (d) | 2 h |
| Benzene | – | 8 d | 11 a | – |
| Toluene | – | 2 d | 5 a | – |
| o-Xylene | – | 20 h | 9 mo | – |
| Formaldehyde | 18 h | 33 h | 7 mo | – |
| Acetaldehyde | 9 d | 18 h | 45 d | – |
| Isoprene | – | 3 h | 4 h | 22 h |
| MBOe | – | 4 h | 10 d | 31 h |
| α-Pinene | – | 5 h | 27 min | 3 h |
| Δ3-Carene | – | 3 h | 18 min | 8 h |
| Humulene | – | 1 h | 5 min | 1 min |
| Longifolene | – | 6 h | 4 h | >23 d |
(a) Concentrations: [OH] = 2 × 106 cm−3 over 12 h per day (daytime); [NO3] = 2 × 108 cm−3 over 12 h per day (nighttime); [O3] = 40 ppb over 24 h per day. Photolysis for the spring equinox (March 20) in Paris calculated over 24 h; cos(θs) = 0.39 on average over 12 h during daytime (see Equations 7.7 to 7.10). Lifetimes are calculated with these values (concentrations or sunlight) averaged over 24 h; therefore, for species with lifetimes less than 24 h, the half-lives are shorter during daytime for photolytic reactions and reactions with OH and O3; they are shorter during nighttime for reactions with NO3.
(b) These reactions were not taken into account because they produce NO, which can subsequently be converted back to NO2 (see Section 8.3); the reaction with OH is the only terminal reaction (see R8.44).
(c) The atmospheric lifetime of methane is actually longer because the kinetics depends on temperature (<25 °C on average) and [OH] decreases with altitude.
(d) No data available on the rates of these reactions.
(e) 2-Methyl-3-buten-2-ol.
8.3 Gas-phase Chemistry of Photochemical Air Pollution
8.3.1 Oxidants
The reactions leading to the formation of the three main oxidant species of photochemical air pollution, OH, NO3, and O3, are described in this section.
As mentioned in Chapter 7, hydroxyl radicals can be formed via the photolysis of ozone:
A chemical kinetic mechanism will also need to take into account the fact that only a fraction of the O(1D) excited oxygen atoms reacts with water vapor, because most of them lose their excess energy by collision with air molecules (N2 or O2) and produce O3 back by reacting next with O2. (At 100 % relative humidity and 25 °C, the reaction with air molecules is about five times faster than that with water vapor.)
In addition to this OH formation pathway, there are two other important photolytic reactions that lead to OH formation in the troposphere: (1) the photolysis of hydrogen peroxide (H2O2) and (2) the photolysis of nitrous acid (HNO2):
In addition, as discussed in Section 8.3.3, OH is also formed by reaction of hydroperoxyl radicals, HO2. They originate mostly from the photolysis of aldehydes. Aldehyde photolysis leads to the production of a hydrogen atom, H, which is then oxidized rapidly by O2 to form HO2. Since the OH radical is formed by photolytic reactions, it is present mostly during daytime. There are, however, some formation pathways that do not require photolysis, such as the decomposition of peroxyacetylnitrate (PAN) in presence of NOx (see the chemistry of PAN in Section 8.3.4) and the oxidation of alkenes by O3 (see Section 8.3.6). However, these reactions are very limited sources of OH and nighttime OH concentrations are negligible.
The nitrate radical (not to be confused with the nitrate ion, NO3−, which is present in the aqueous phase, see Chapter 10) is formed via the reaction of nitrogen dioxide with ozone:
This radical is rapidly photolyzed:
Its formation does not require any photochemical reaction; therefore, it can be formed either at night or during the day. However, its rapid photolysis diminishes significantly its concentration during daytime. Thus, this oxidant plays a role mostly at night. Since the kinetics of the reaction of O3 with NO is about 1,000 times faster than that with NO2, NO concentrations are negligible when NO3 is present, because NO will have almost entirely been oxidized into NO2.
Ozone is formed in the stratosphere by photolysis of oxygen molecules (see Chapter 7). Solar radiation that leads to oxygen photolysis is filtered in the stratosphere and is, therefore, unavailable in the troposphere to lead to ozone formation there. However, the photolysis of nitrogen dioxide, which takes place in the visible and the near ultraviolet (UV) range, takes place in the troposphere:
Therefore, ozone formation takes place in the presence of sunlight, i.e., during daytime. However, the lifetime of ozone ranges from several hours to a few days. Thus, its oxidizing power can also occur at night.
In summary, the atmospheric gaseous oxidants are the following:
– During daytime: OH and O3
– During nighttime: NO3 and O3
8.3.2 The Photostationary State of Leighton
Ozone formation is balanced by its destruction by nitric oxide:
This reaction is very fast and can, therefore, be called a titration reaction when considered in isolation, i.e., it stops when one of the two reactants (NO or O3) has been entirely depleted. In the atmosphere, in the presence of sunlight, O3 can be continuously regenerated by NO2 photolysis. Thus, a system of three reactions that are at equilibrium occurs, i.e., the rates of these three reactions are identical. This set of three reactions, which are at steady state, is called the photostationary state of Leighton, named after the Stanford chemistry professor, Philip A. Leighton.
These three reactions are as follows:
 (R8.11)
  (R8.9)
  (R8.10)
 The rate constants are given here at 1 atm and 25 °C. A typical average daytime photolysis rate is used. At steady state, the rates of the three reactions are equal:
The first equation leads to:
 (8.16)
 In addition, the sum of the concentrations of nitrogen oxides must remain constant:
where the subscript 0 indicates the initial concentration. Each ozone molecule reacting with NO leads to a molecule of NO2, and each photolyzed NO2 molecule leads to a molecule of ozone; therefore, the sum of the concentrations of O3 and NO2 remains constant:
Thus, the concentrations of nitrogen oxides can be calculated as a function of the initial concentrations and the ozone concentration:
 (8.19)
 Replacing [NO2] and [NO] in Equation 8.16:
 (8.20)
 The ozone concentration is then the solution of a quadratic equation:
 (8.22)
 Example: Calculation of the ozone concentration produced from nitrogen oxides
The initial nitrogen oxide concentrations are as follows: [NO]0 = 100 ppb, [NO2]0 = 5 ppb. There is no ozone present initially: [O3]0 = 0 ppb.
The solution is: [O3] = 0:5 ppb
The ozone concentration produced from only nitrogen oxides is, therefore, very low.
8.3.3 Oxidation of Carbon Monoxide (CO)
The chemistry of CO is simple and is, therefore, convenient to explain ozone formation when volatile carbonaceous species (CO or VOC) are present. CO is oxidized by OH radicals:
Hydrogen atoms are not stable, and they recombine rapidly with molecular oxygen to form hydroperoxyl radicals (HO2):
Then, these radicals react rapidly to oxidize NO into NO2:
The OH radical has been regenerated, and the total budget of these three reactions is then as follows:
Therefore, the oxidation of CO into CO2 leads to the conversion of NO into NO2. NO2 can be photolyzed to form NO and O3. Since NO is converted to NO2 without consumption of O3 (unlike what happens in the Leighton photostationary state), there is formation of a molecule of O3 for each molecule of CO that is oxidized. This yield is theoretical because all HO2 radicals do not react with NO and some OH radicals may react with NO2. The actual yield is, therefore, less than 1. The presence of a carbonaceous species (here CO, but VOC play a similar role, see Sections 8.3.4 to 8.3.8) leads to a perturbation of the photostationary equilibrium, thereby allowing the formation of NO2 without O3 consumption and leading, therefore, to O3 formation.
Example: Calculation of the ozone concentration produced from carbon monoxide in presence of nitrogen oxides
The initial concentration of CO is 1 ppm and its oxidation occurs over an 8-hour period. The OH radical concentration is assumed to be 106 cm−3.
The rate constant of the oxidation of CO by OH is 0.35 ppb−1 min−1 at 1 atm and 25 °C. The OH concentration in ppb is: 106 / (2.46 × 10¹⁰) = 4 × 10⁻⁵ ppb. Formation of O3 over eight hours is theoretically equivalent to the amount of CO that has reacted. Therefore:

Thus, 1 ppm of CO (which is not very reactive) has formed 6 ppb of O3 in eight hours. Therefore, it is the presence of volatile carbonaceous compounds (here CO, but also reactive VOC), which leads to ozone formation, as correctly identified originally by Haagen-Smit.
8.3.4 Photolysis and Oxidation of Aldehydes
The simplest aldehyde (i.e., the aldehyde with only one carbon atom) is formaldehyde (HCHO). Its oxidation occurs by photolysis or by reaction with OH. There are two pathways for the photolysis of formaldehyde. On one hand:
Thus, the overall budget is:
On the other hand:
The two products of this reaction are stable molecules (CO will of course be oxidized slowly as described in Section 8.3.3). These two photolysis reactions have similar kinetics. Therefore, one may write a simple overall budget as being the average of these two reactions:
Oxidation by OH leads to the following reactions:
The OH radical abstracts a hydrogen atom from the formaldehyde molecule to form a stable molecule (water vapor, H2O) and an unstable organic radical. Therefore, one obtains an overall budget that is similar to that obtained with the photolytic reactions:
Thus, the oxidation of HCHO, whether it occurs by reaction with OH or results from photolytic reactions leads to one molecule of CO and one HO2 radical. As shown in Section 8.3.3, the HO2 radical can later oxidize NO into NO2 and form an OH radical. The photolysis of NO2 leads to the formation of a molecule of O3. Since the oxidation of a molecule of CO leads also to the formation of a molecule of O3, the oxidation of HCHO can theoretically lead to the formation of two molecules of O3.
The oxidation of higher aldehydes (i.e., aldehydes with more than one carbon atom) follows the same conceptual scheme as that of formaldehyde, but leads to more complex products due to the greater number of carbon atoms. For example, the reactions of acetaldehyde (two carbon atoms, CH3CHO) are as follows:
The overall budget is as follows:
In this first oxidation step, H originating from formaldehyde has been replaced by CH3 originating from acetaldehyde. The methylperoxyl radical (also called peroxymethyl), CH3O2, behaves similarly to HO2, that is to say that it can oxidize NO into NO2 and form a methoxy radical, CH3O:
The methoxy radical reacts next with O2 to form formaldehyde and the hydroperoxyl radical:
The HO2 radical can subsequently oxidize another NO molecule into NO2, thereby potentially leading to the formation of another O3 molecule. Therefore, there may be formation of up to six molecules of O3 from the photolysis of acetaldehyde (one from the oxidation of CO, one due to the formation of NO2, two from the HO2 radicals, and two from the oxidation of HCHO).
The other photolytic pathway is also possible:
As shown in Section 8.3.5, methane can lead to the formation of four molecules of O3, but its lifetime is very long; therefore, it is considered to be chemically inert at the time scales of photochemical air pollution.
The oxidation of acetaldehyde by OH occurs according to the following pathway:
 (R8.30)
 Peroxyacetyl nitrate, CH3C(O)O2NO2, is commonly called PAN. PAN-type compounds may also be formed from higher aldehydes (propanal, butanal, etc.), in which case PAN refers more generally to peroxyacyl nitrates. Thus, the oxidation of VOC with several carbon atoms leads to more complex products. PAN is an important product because it is the organic nitrate species that is present at the highest ambient concentrations in the atmosphere. PAN can undergo a thermal decomposition reaction in the atmosphere:
PAN, when formed at a low temperature, can be transported over long distances and, when it encounters higher temperatures, it can decompose and form NO2 back, and potentially O3. PAN is, therefore, a “reservoir” species, because it acts as a reservoir of O3 precursor.
Aldehydes are the only VOC that have significant photolytic rates. Calvert et al. (2011) provide a detailed state of the science of the atmospheric chemistry of aldehydes.
8.3.5 Oxidation of Alkanes
The simplest alkane (one carbon atom) is methane. Methane is a greenhouse gas, which reacts slowly with OH (lifetime on the order of several years). Therefore, it is not included in photochemical air pollution studies. Nevertheless, its oxidation mechanism being simple, it provides a useful conceptual model of the oxidation of alkanes in general:
As with aldehydes (see Section 8.3.4), the OH radical abstracts an H atom from the alkane molecule to form a stable H2O molecule, and generates at the same time an organic radical (CH3), which is rapidly oxidized by reaction with O2 into a methylperoxyl radical (CH3O2). As discussed, this peroxyl radical and HO2 may react with NO to form NO2. The oxidation of methane leads theoretically to four molecules of O3 (one via the formation of a molecule of NO2 from CH3O2, two by the oxidation of HCHO and one from HO2).
Higher alkanes, i.e., those with more carbon atoms (ethane, propane, butane, pentane, etc.), follow similar oxidation pathways. Let RH be a generic alkane (thus, R = CH3 for methane, R = C2H5 for ethane, etc.):
where R’ has one less carbon atom than R. The mechanism is identical to that of methane, except that instead of formaldehyde being the product, a higher aldehyde is obtained (for example, acetaldehyde for ethane). In addition, minor reaction pathways lead to the formation of organic nitrates (RONO2) and peroxynitrates (RO2NO2):
 (R8.40)
  (R8.41)
 For RO radicals, other chemical pathways include decomposition into an aldehyde and a peroxyl radical and, when R > C4, isomerization, which leads to a peroxyl radical and an alcohol group.
Figure 8.1 shows a partial reaction mechanism of the oxidation of n-pentane (an alkane with five carbon atoms) by OH radicals. There are five possible sites for the abstraction of a hydrogen atom by OH; however, for symmetry reasons, this corresponds to only three possible products with formation of a peroxyl radical in positions 1, 2, or 3 (from left to right in Figure 8.1). The yields of these three oxidation pathways are about 8, 57, and 35 %, respectively. Therefore, the probability of abstraction of a hydrogen atom is greater in an internal position than in a terminal position. The following steps are shown in Figure 8.1 only for the 2-pentyl-peroxyl radical, because (1) it is the radical that is formed in greater amount and (2) it provides the most complete reaction mechanism. The peroxyl radical can react with other peroxyl radicals, such as HO2 and CH3O2 (i.e., those peroxyl radicals present in greater concentrations in the atmosphere), to form a peroxide when reacting with HO2 or various oxygenated organic compounds when reacting with CH3O2. When NOx concentrations are high, the other chemical pathways are favored. The reaction of NO2 to form an organic peroxynitrate is fast, but reversible. The reactions with NO can lead either to the formation of an organic nitrate or to the oxidation of NO into NO2 with formation of an alkoxy radical. This alkoxy radical can react along three distinct pathways: isomerization, decomposition, and oxidation by O2. All these pathways lead to the formation of HO2 and/or NO2, and, therefore, to the potential formation of O3.

Figure 8.1. Oxidation of n-pentane: oxidation by OH leading to the formation of peroxyl radicals, and reactions of the 2-pentyl-peroxyl radical.
As shown in Figure 8.2, alkanes with several carbon atoms are more reactive when the number of carbon atoms increases, because in first approximation an OH radical has a greater probability to encounter an hydrogen atom and abstract it from the alkane molecule. Therefore, ethane (two carbon atoms) is more reactive than methane (one carbon atom), butane (four carbon atoms) is more reactive than propane (three carbon atoms), etc.

Figure 8.2. Kinetics of oxidation by OH of selected n-alkanes.
Alkanes can also be oxidized by NO3 radicals. The chemical mechanism is similar to that of the oxidation by OH radicals, because the NO3 radical also abstracts a hydrogen atom from the alkane molecule to form a stable molecule of nitric acid, HNO3:
However, the subsequent reactions differ from those resulting from the oxidation by OH, because NO concentrations are negligible when those of NO3 are high. These differences are shown in Section 8.3.6 for alkenes, which have faster NO3 oxidation kinetics than alkanes.
Alkanes are oxidized by OH during daytime and by NO3 at night. However, the oxidation kinetics by NO3 is much slower than that by OH (see Table 8.1). Calvert et al. (2008) provide a detailed state of the science of the atmospheric chemistry of the alkanes.
8.3.6 Oxidation of Alkenes
The oxidation of alkenes differs from that of alkanes because of their double bond, which is a more favorable site for attack by the OH and NO3 radicals, and also by ozone. Therefore, instead of abstracting a hydrogen atom from the organic molecule, the OH and NO3 radicals attach to one of the carbon atoms of the double bond. Figure 8.3 shows the chemical mechanism of the oxidation of propene (three carbon atoms, also called propylene) by OH. The OH radical can attach to either one of the carbon atoms of the double bond, but it tends to favor the formation of the radical on the secondary carbon (CH3CHC(OH)H2), i.e., the carbon atom that is linked to two other carbon atoms (65 % for that pathway, compared to 35 % for the other pathway). Next, these radicals react rapidly with molecular oxygen to form peroxyl radicals. These peroxyl radicals can then react with NO, either to form NO2 and alkoxy radicals, or to form organic nitrates. However, the formation of nitrates is a relatively minor pathway (<2 %) and the formation of NO2 prevails. Then, the alkoxy radicals undergo decomposition by reaction with O2 to form aldehydes. In the case of propene, both chemical reaction pathways lead to the same products, which are formaldehyde and acetaldehyde. Then, the aldehydes lead to ozone formation (for example, two molecules of ozone in the case of formaldehyde, see Section 8.3.4). For alkenes with a greater number of carbon atoms, the mechanism is similar, but it leads to more complex oxo products (aldehydes and ketones).

Figure 8.3. Oxidation of propene by OH.
The NO3 radicals follow the same general scheme in principle and attach to one of the carbon atoms of the double bond. However, the following steps differ, because the NO concentrations are negligible when NO3 concentrations are significant. Therefore, the organic peroxyl radical does not react with NO, but instead reacts with other peroxyl radicals, such as HO2 and CH3O2. Figure 8.4 shows the main oxidation pathways for the reaction of propene with NO3. The oxidation products are mostly organic nitrates with other functional groups, such as peroxide, alcohol or oxo. In the case of propene, products include formaldehyde and acetaldehyde, as well as NO2 via decomposition of the nitrated alkoxy radical. Unlike alkanes, alkenes can have oxidation kinetics with NO3 that are faster than those with OH, particularly in the case of biogenic compounds.

Figure 8.4. Oxidation of propene by NO3.
Alkenes are the only VOC that react with ozone. Figure 8.5 shows the chemical mechanism of the oxidation of propene by O3. Ozone adds to the double bond creating a bridge between the two carbon atoms. This unstable species is called an ozonide. The products of the ozonide are oxo compounds (aldehydes and ketones) and biradicals (which, therefore, include two reactive sites with free electrons). In the case of propene, formaldehyde and acetaldehyde are formed. The biradicals, which are called Criegee radicals (named after Rudolf Criegee, who first identified them), are extremely reactive and lead to the formation of stable products (in the case of propene, CO, CO2, CH4, as well as formic acid and acetic acid) and radicals (OH, H, CH3, HCO, CH3O2) that lead to ozone formation. In particular, one notes that OH radicals are formed. The yield of these OH radicals has been estimated to be 12 % from the H2CO2 biradical and 54 % from the CH3 C(H)O2 biradical. If both reaction pathways of the ozonide are about equivalent, the overall estimated OH yield is 33 %, which is consistent with the overall estimate. The OH yields can be significant; they vary from about 6 % for β-caryophyllene to nearly 120 % for cyclopentene. For some alkenes, the oxidation by O3 is competitive with that by the OH and NO3 radicals. The oxidation rate by O3 is much greater for an internal alkene (internal double bond) than for a terminal alkene (double bond located at the end of the molecule); see Table 8.1.

Figure 8.5. Oxidation of propene by ozone.
Calvert et al. (2000) provide a detailed state of the science for the atmospheric chemistry of the alkenes.
8.3.7 Oxidation of Aromatic Compounds
The oxidation of aromatic compounds differs also from that of alkanes. The oxidation by OH can follow the same pathway as that of the alkanes with the abstraction of a hydrogen atom from the molecule to form an organic radical and a water molecule. However, this oxidation pathway is minor (<10 %) and it is the addition of the OH radical to the aromatic ring that prevails, because this addition requires less energy. There are two possibilities following this addition of OH to the ring:
– The aromatic ring is conserved (for example, in the case of toluene, formation of cresol and its derivative products)
– The aromatic ring is broken and species with fewer carbon atoms are formed
Figure 8.6 shows some of the chemical oxidation pathways and products of the oxidation of toluene (seven carbon atoms with a methyl group attached to the aromatic ring) by OH.

Figure 8.6. Oxidation of toluene by OH: major oxidation pathways and formation of major products.
The abstraction of a hydrogen atom from the methyl group leads to the formation of benzaldehyde, but with a benzaldehyde yield estimated to be about 6 %. Next, benzaldehyde reacts to form mostly nitrophenol.
The second oxidation pathway accounts for more than 90 % and leads to the formation of a radical that reacts with O2, which either abstracts a hydrogen atom to form cresols and HO2 (a potential source of O3) or adds to the aromatic ring to form a peroxyl radical. The formation of cresols (mostly ortho-cresol, i.e., the CH3 and OH groups are adjacent on the aromatic ring) accounts for about 18 % of the oxidation of toluene (about 12 % of ortho-cresol, 3 % of meta-cresol, and 3 % of para-cresol). The oxidation of cresols leads to the formation of peroxyl radicals that can lead to O3 formation via the conversion of NO to NO2 or can react with NOx to form nitrocresols. In the latter case of the formation of an aromatic peroxyl radical, which accounts for >70 % of the toluene oxidation, there is mostly an opening of the aromatic ring. The products include aldehydes with fewer than six carbon atoms (glyoxal, methylglyoxal, methylbutenedial, 1,4-butenedial, 2-methyl-2,4-hexadiene-1,6-dial). Among those species, glyoxal and methylglyoxal are the most important ones with yields on the order of 4 to 17 % and 4 to 24 %, respectively.
The oxidation pathways where the aromatic ring is conserved lead to stable species (benzaldehyde, cresol, nitrated derivatives) and, therefore, little ozone formation. However, these species are not very volatile because of their high number of carbon atoms and they lead to particulate matter formation via the formation of particulate organic compounds (see Chapter 9). In addition, the formation of nitrated organic compounds leads to the elimination of nitrogen oxides (NO and NO2) from the chemical system and, therefore, potentially less ozone. The oxidation pathways where the aromatic ring is opened lead to reactive species (dioxo compounds, i.e., species with two carbonyl groups, and in particular, dialdehydes) leading rapidly to ozone formation. On the other hand, these species have few carbon atoms and are, therefore, unlikely to lead to the formation of particulate organic compounds (however, their aqueous chemistry may lead to species with low volatility). The relative importance of these two main oxidation pathways (ring-retaining versus ring-opening) has long been poorly understood and still remains a source of uncertainty in photochemical air pollution.
Aromatic compounds can be oxidized by NO3; however, the kinetics is much slower than that with OH radicals (see Table 8.1). Calvert et al. (2002) provide a detailed state of the science of the atmospheric chemistry of aromatic compounds.
8.3.8 Oxidation of Biogenic Compounds
Biogenic compounds include hemiterpenes, monoterpenes, sesquiterpenes, and terpenoids. The most important biogenic compound in terms of atmospheric emissions is isoprene (the hemiterpene), which is a hydrocarbon with five carbon atoms and two double bonds. The term “terpene” refers to a compound that is formed from a combination of several isoprene molecules (two for a monoterpene and three for a sesquiterpene) and, therefore, contains only carbon and hydrogen atoms. The term “terpenoid” is used when methyl groups have been removed or moved or when the compound contains one or more oxygen atoms. For simplicity, we use hereafter the term terpene to refer to all terpenes and terpenoids.
Isoprene is the biogenic compound that has been studied the most in terms of its atmospheric chemistry. The two double bonds are attack sites for OH and NO3 radicals, as well as for O3. The oxidation by OH leads to the formation of aldehydes and ketones. The most important ones are methacrolein (MACR) and methyl vinyl ketone (MVK). Isoprene is an important precursor of ozone.
Monoterpenes and other terpenes contribute also to the formation of ozone, but to a lesser extent, because their emissions are less important than those of isoprene (see Chapter 2). Accordingly, their chemistry has been studied more in terms of their contribution to the formation of organic particulate matter. Indeed, their number of carbon atoms (10 for monoterpenes and 15 for sesquiterpenes) favors the formation of compounds with low saturation vapor pressures, which can condense readily on particles. Therefore, the chemistry of biogenic compounds is discussed further in Chapter 9. One notes, however, that these compounds have short lifetimes (see Table 8.1), because they are oxidized rapidly by several oxidant species (OH, NO3, and O3).
8.3.9 Termination of the Oxidation Cycles
The formation of ozone occurs when NO is converted to NO2 by peroxyl radicals (hydroperoxyl, HO2, or organic peroxyl, RO2), i.e., without any consumption of O3. Thus, NO2 forms O3 during the day by photolysis. This formation takes place as long as peroxyl radicals are formed by the oxidation of VOC and CO. It can stop (or at least it can be slowed down) when one of the key species of this mechanism is consumed by a reaction that leads to a stable product. There are two main possibilities to stop the formation of ozone.
On one hand, the peroxyl radicals can react without converting NO to NO2. They can react among themselves to form a peroxide or some other stable products. For example, the hydroperoxyl radicals can form hydrogen peroxide:
Another possibility for peroxyl radicals is the formation of organic nitrates or peroxynitrates (nitric acid is the inorganic nitrate), when NO and NO2 react with organic peroxyl radicals. For example, PAN may be formed following the oxidation of acetaldehyde (see Section 8.3.4).
On the other hand, NO2 can be oxidized into a stable product instead of being photolyzed. Its main oxidation pathway is by reaction with OH radicals to form nitric acid:
Therefore, there is competition in the former case for the reaction of peroxyl radicals either with NO to form NO2 or with other peroxyl radicals or NOx to form stable products such as peroxides and organic nitrates. In the latter case, there is consumption of NO2 either by photolysis leading to O3 formation or by reaction with OH to form HNO3. We will see in Section 8.4 that the relative importance of these reaction pathways for peroxyl radicals and for NO2 depends on the chemical regime of the atmosphere.
8.4 Chemical Kinetic Mechanisms of Photochemical Air Pollution
To simulate the formation of gaseous photochemical pollutants such as O3 and NO2 requires setting up a chemical kinetic mechanism that takes into account the major reactions involved in the formation of those gaseous air pollutants.
8.4.1 Conceptual Mechanism of Photochemical Air Pollution
Figure 8.7 presents a schematic description of the oxidation of an alkane, RH, by OH. In the first step, the oxidation of RH by OH leads to the formation of an organic peroxyl radical, RO2, which reacts with NO to form NO2 and RO. The organic alkoxy radical, RO, undergoes oxidation leading to the formation of an aldehyde (here called R’CHO, where R’ contains one less carbon atom than RH) and a hydrogen atom, which is rapidly oxidized into HO2. The HO2 radical leads to another oxidation of NO to NO2 and the regeneration of the OH radical. Therefore, this oxidation of the alkane leads to the formation of two ozone molecules, since each NO2 molecule is photolyzed during daytime and leads to the formation of NO and O3. In addition, the aldehyde will be either oxidized by OH or photolyzed, which will lead to the formation of other O3 molecules. Therefore, the oxidation of an alkane leads to the formation of several O3 molecules via (1) the formation of peroxyl radicals and (2) the formation of an aldehyde, which via photolysis or oxidation will lead to the formation of other peroxyl radicals. As discussed, the oxidations of alkenes and aromatic compounds follow different reaction schemes, but the general conceptual approach is similar.

Figure 8.7. Schematic representation of the chemistry of ozone formation from an alkane, RH.
8.4.2 Simple Chemical Kinetic Mechanism of a Hydrocarbon
Table 8.2 lists the reactions corresponding to the oxidation mechanism of a generic hydrocarbon and its aldehyde product associated with the first oxidation step, as shown in Figure 8.7. This list of 20 reactions can be reduced during the development of the set of the ordinary differential equations representing the kinetics of the chemical species involved, because the reactions with molecular oxygen, O2, are very fast. Thus, the reactions of the oxygen atom, O, and of the organic alkoxy radical, RO, with O2 have kinetics that are not limiting and, accordingly, they can be lumped with the reactions leading to their formation. Then, this mechanism may be reduced to 18 reactions, after the lumping of Reaction 3 with Reactions 2 and 5 and Reaction 11 with Reaction 10. We can write the set of the corresponding differential equations as follows, using the stationary state approximation for the radicals (the numbering of the reactions and their rate constants corresponds to those of Table 8.2).
Table 8.2 Simplified chemical kinetic mechanism of the oxidation of a generic hydrocarbon.
| Reaction | Rate constanta |
|---|---|
| 1. NO + O3 → NO2 + O2NO+O3 → NO2+O2 | 1.8 × 10⁻¹⁴ cm3 molecule−1 s−1 |
| 2. NO2 + hν → NO + ONO2+hν → NO+O | 7.9 × 10⁻³ s−1 |
| 3. O + O2 + M → O3 + MO+O2+M → O3+M | 6 × 10⁻³⁴ cm6 molecule−2 s−1 |
| 4. O3 + hν → O2 + O(1D)O3+hν → O2+O(1D) | 4.5 × 10⁻⁵ s−1 |
| 5. O(1D) + M → O + MO(1D)+M →O+M | 2.9 × 10⁻¹¹ cm3 molecule−1 s−1 |
| 6. O(1D) + H2O → 2 OHO(1D)+H2O → 2 OH | 2.2 × 10⁻¹⁰ cm3 molecule−1 s−1 |
| 7. NO + HO2 → NO2 + OHNO+HO2 → NO2+OH | 8.3 × 10⁻¹² cm3 molecule−1 s−1 |
| 8. O3 + HO2 → OH + 2 O2O3+HO2 → OH+2 O2 | 1.9 × 10⁻¹⁵ cm3 molecule−1 s−1 |
| 9. RH + OH(+ O2) → RO2 + H2ORH+OH (+O2) → RO2+H2O | 2.6 × 10⁻¹¹ cm3 molecule−1 s−1 |
| 10. NO + RO2 → NO2 + RONO+RO2 → NO2+RO | 7.7 × 10⁻¹² cm3 molecule−1 s−1 |
| 11. RO + O2 → R‘CHO + H2ORO+O2 → R‘CHO+HO2 | 9 × 10⁻¹⁵ cm3 molecule−1 s−1 |
| 12. R‘CHO + OH(+ O2) → R‘C(O)O2 + H2OR‘CHO+OH (+O2) → R‘C(O)O2+H2O | 1.6 × 10⁻¹¹ cm3 molecule−1 s−1 |
| 13. NO + R‘C(O)O(+O2) → NO2 + R‘O2 + CO2NO+R‘C(O)O2 (+O2) → NO2+R‘O2+CO2 | 2 × 10⁻¹¹ cm3 molecule−1 s−1 |
| 14. NO2 + R‘C(O)O2 → PANNO2+R‘C(O)O2 → PAN | 1 × 10⁻¹¹ cm3 molecule−1 s−1 |
| 15. PAN → NO2 + R‘C(O)O2PAN → NO2+R‘C(O)O2 | 3.2 × 10⁻⁴ s−1 |
| 16. R‘CHO + hν → R‘H + COR‘CHO+hν → R‘H+CO | 5.2 × 10⁻⁶ s−1 |
| 17. R‘CHO + hν(+ 2 O2) → R‘O2 + H2O + COR‘CHO+hν (+2 O2) → R‘O2+HO2+CO | 5.7 × 10⁻⁶ s−1 |
| 18. NO2 + OH(+ M) → HNO3(+ M)NO2+OH (+M) → HNO3 (+M) | 9.2 × 10⁻¹² cm3 molecule−1 s−1 |
| 19. HO2 + HO2 → H2O2 + O2HO2+HO2 → H2O2+O2 | 1.5 × 10⁻¹² cm3 molecule−1 s−1 |
| 20. RO2 + HO2 → ProductsRO2+HO2 → Products | 5.6 × 10⁻¹² cm3 molecule−1 s−1 |
(a) Values given at 1 atm and 25 °C on June 21 at noon in Paris with a clear sky; photolytic reactions 2, 4, 16, and 17 depend on the zenith angle, cloudiness, and atmospheric particulate matter concentration; all reactions, except the photolytic reactions, depend on temperature. Sources of the rate constants: Jacobson (2005) except for Reaction 9, which uses the kinetics of propene as the generic hydrocarbon (Calvert et al., 2000), Reaction 11 (Finlayson-Pitts and Pitts, 2000) and Reaction 18 (Mollner et al., 2010). The kinetics of peroxyacetyl nitrate was used for the generic peroxyacyl nitrate (called PAN here), that of acetaldehyde for the generic aldehyde, and that of the methylperoxyl radical for Reaction 20.
The radicals and atom of this reacting system are O(1D), OH, HO2, RO2, and R’O2 (the RO radical and the O atom are ignored following the lumping of their formation and destruction reactions). In addition, the RO2 and R’O2 radicals are lumped here as organic peroxyl radicals and the sum of their concentrations is represented by [RO2]. Thus, there are five species at stationary state and ten species with time-dependent concentrations. The concentrations of the stationary-state species can be obtained with algebraic equations, and the time-dependent concentrations are governed by ordinary differential equations.
The stationary-state solution for [O(1D)] is as follows:
 (8.23)
 That is: [O(1D)]=k4[O3]k5[M] + k6[H2O]
The stationary-state solution for [OH] is as follows:
 (8.24)
 That is:

The stationary-state solution for the concentration of the hydroperoxyl radical (HO2) requires the solution of a quadratic algebraic equation:
 (8.25)
 That is:

The concentrations of the organic peroxyl radicals, RO2 and R’O2, are lumped as [RO2]. Since their self-reaction is neglected compared to their reaction with HO2 (which is present in greater concentration), the solution is simpler than that for HO2:
 (8.26)
 That is: [RO2]= k9[RH][OH] + k13[R’C(O)O2][NO] + k17[R’CHO]k10[NO] + k20[HO2]
The algebraic equation for the peroxyacyl radical is as follows:
 (8.27)
 That is: [R’C(O)O2]=k12[R’CHO][OH]+k15[PAN]k13[NO]+k14[NO2]
For the other species, the ordinary differential equations are as follows:
 (8.28)
  (8.29)
  (8.30)
  (8.31)
 (8.33)
  (8.34)
  (8.35)
  (8.36)
  (8.37)
 The numerical solution of these ordinary differential equations provides the temporal evolution of the concentrations of these chemical species given their initial concentrations. The numerical methods that can be used to solve such a set of equations are described in Chapter 7.
8.4.3 Spatio-temporal Variability of Photochemical Air Pollution
The diurnal profile of ozone concentrations shows a peak in midday, since ozone formation results from the photolysis of NO2 and the photolysis kinetics is maximum at noon. Ozone formation continues during the afternoon until the ozone destruction reactions (e.g., the NO titration reaction) begin to overcome the formation reaction, i.e., the NO2 photolysis, as radical (OH and HO2) production starts to slow down (i.e., when the Sun comes down toward the horizon). Figure 8.8 depicts temporal profiles of measured and simulated ozone concentrations corresponding to a photochemical air pollution episode in the Los Angeles Basin in 1974, that is, at a time when air pollution levels were still very high (maximum hourly concentrations >300 ppb, i.e., about 600 μg m−3).

Figure 8.8. Temporal profiles of ozone (O3, top figure) and nitrogen dioxide (NO2, bottom figure) concentrations on June 26 and 27, 1974 in the Los Angeles Basin, California (in pphm, “parts per hundred million”; 1 pphm = 10 ppb). The small squares correspond to the measurements and the lines correspond to the results of a numerical simulation. The solid lines correspond to the simulation at the location of the measurement; the dotted lines correspond to optimal solutions obtained at one or two model grid cells of the measurement location. O3 concentrations are in Pasadena, downwind of Los Angeles; NO2 concentrations are in downtown Los Angeles.
Figure 8.8 shows temporal profiles of measured and simulated NO2 concentrations for the same Los Angeles air pollution episode. The diurnal profile of the nitrogen dioxide (NO2) concentrations shows peaks during the traffic rush hour (i.e., in the morning and in late afternoon) and lower concentrations during the day when emissions are lower and photolysis of this compound is more important. The maximum NO2 concentration reaches 300 ppb (about 600 μg m−3) during the early-morning peak of the second day.
The spatial distribution of the ozone concentrations typically shows lower concentrations near nitrogen oxides (NOx) sources because of the titration of O3 by NO. Thus, the maximum O3 concentrations occur downwind of the source regions, since it takes some time for the kinetics of the photochemical reactions to occur and to lead to ozone formation. On the other hand, the maximum NO2 concentrations occur mostly near NOx sources, i.e., in urban areas near major roadways. For example, the O3 concentrations shown in Figure 8.8 correspond to a location in Pasadena, i.e., downwind of the industrial areas (located on the coast) and of the downtown area. Figure 8.9 depicts maps of simulated concentrations of O3 and NO2 for the Paris region in 2009. The high NO2 concentrations appear in the downtown Paris area, near major roadways, near the airports, and near an industrial site. On the other hand, the O3 concentrations are negligible in these locations because of the titration reaction with NO and they are high outside of the urban area.

Figure 8.9. Spatial distribution of simulated O3 and NO2 concentrations for 2009 in the Paris region. The simulation was performed with the Polyphemus numerical model. Top figure: O3 concentrations (annual average in μg m−3 of the daily maximum 8-hour average concentrations); bottom figure: NO2 concentrations (annual average in μg m−3). Concentrations are indicated on the right vertical axis. Latitude (°N) and longitude (°E) are indicated on the left vertical axis and horizontal axis, respectively.
8.5 Emission Control Strategies for Photochemical Air Pollution
8.5.1 Chemical Regimes of Photochemical Smog
Ozone formation occurs when the Leighton photostationary state undergoes a perturbation due to the addition of VOC or CO, thereby leading to the formation of peroxyl radicals, which can convert NO to NO2 without consuming O3. NO2 photolysis leads to the formation of one molecule of O3 and regenerates NO. NO can then be converted back to NO2, either by reaction with O3 (null O3 balance) or by reaction with a peroxyl radical (potential formation of an O3 molecule). Therefore, there is competition between these two NO oxidation pathways and we may distinguish two chemical regimes:
– A regime where the peroxyl radical concentrations are not limiting compared to NO (or more generally NOx) concentrations
– A regime where the peroxyl radical concentrations are limiting compared to NO (or more generally NOx) concentrations
The peroxyl radicals are formed by oxidation of VOC or CO. However, CO is significantly less reactive than most VOC and, therefore, one may consider that high peroxyl radical concentrations result from high VOC concentrations. These two regimes may, therefore, be defined in terms of the relative concentrations of NOx and VOC:
– A regime rich in VOC and poor in NOx (hereafter referred to as low-NOx regime)
– A regime poor in VOC and rich in NOx (hereafter referred to as high-NOx regime)
There is of course an intermediate regime. However, most atmospheric conditions tend to fall within one of these two extreme regimes.
These different chemical regimes can be characterized in terms of their chemical kinetics according to the mechanism presented in Figure 8.7, using the rate constants listed in Table 8.2. We use here the conceptual approach of Jacob (1999) with some modifications. Ozone is formed by photolysis of NO2 following the oxidation of NO by a peroxyl radical (RO2 or HO2). Therefore, the formation rate of O3, PO3, can be expressed as follows:
The OH and HO2 radicals, represented together as HOx, play a key role in this scheme of O3 formation. They are formed mostly by the photolysis of O3 and nitrous acid (HNO2) in the case of OH and by the photolysis of aldehydes in the case of HO2. Their formation kinetics are represented here by POH and PHO2, respectively. Furthermore, we define PHOx = POH + PHO2, to represent the formation of all HOx radicals. POH is greater than PHO2, the former being typically about 50 to 80 % of PHOx (Mao et al., 2010). The main termination reactions are, for OH, the formation of nitric acid (HNO3) and, for HO2, the formation of peroxides by reaction with HO2 or RO2. At steady state, their production rate is equal to the rate of their termination reactions and we have the following relationship:
Assuming steady state for these radicals:
 (8.40)
The rates of the propagation reactions of these radicals are assumed to be significantly faster than their formation and termination reactions (the ratio of these rates is typically on the order of 5 to 10; Mao et al., 2010). Therefore, we obtain the following relationships:
Then, the production of O3 can be expressed as follows:
In addition, since the values of the rate constants k7 and k10 are similar, the following simplifying assumption may be introduced:
Thus, replacing [RO2] by [HO2] in the steady-state relationship between production and termination of the HOx radicals:
Low-NOx Regime
In a low-NOx regime, the formation of peroxides governs the termination reactions. Therefore, the first term of PHOx (Equation 8.46) can be neglected and we have:
 (8.47)
 Then, we can write the formation of O3 (Equation 8.44) simply as a function of HOx production and the concentration of NO:
 (8.48)
 Thus, in a low-NOx regime, O3 formation is proportional to the concentration of NO and to the square root of the production of HOx radicals.
High-NOx Regime
In a high-NOx regime, nitric acid formation governs the termination reactions and the second term of PHOx (Equation 8.46) can be neglected. The OH concentration may then be calculated as follows:
 (8.49)
 The production of O3 can be expressed simply as a function of the HOx production and the concentrations of RH and NO2:
 (8.50)
 This result implies that the rate of propagation of the radicals is much greater than that of their termination (assumption made to obtain Equations 8.42 and 8.43). However, this assumption is not always verified. For example, the ratio of these rates is only about 2 in New York (Mao et al., 2010) and could be close to 1 in Paris (based on reactivity and ambient concentrations measurements; Borbon et al., 2013; Airparif, 2015). Then, the steady-state relationship for [OH] leads to the more general relationship:
The steady-state assumption made for [HO2] leads to the following relationship (neglecting the termination reactions of the peroxyl radicals, which is appropriate in a high-NOx regime):
Therefore, substituting these two terms in the equation for the production of O3 (Equation 8.38), leads to the following solution:
Substituting [OH] by its value as a function of PHOx:
 (8.54)
 Then, writing POH as a function of PHOx and PHO2, the general equation for the formation of O3 in a high-NOx regime is obtained:
 (8.55)
 The previous equation for PO3 in the high-NOx regime is obtained when k18 [NO2] ≪ k9 [RH]. In a high-NOx regime, O3 formation is proportional to the production of HOx radicals and to the [RH]/[NO2] ratio. If the regime is very high NOx, then, the O3 formation rate tends toward the production rate of HO2 radicals, which corresponds mostly to the photolysis rate of aldehydes.
Nitrogen oxides have a relatively short lifetime (a few hours for NO2 by reaction with OH); therefore, in the absence of important NOx emissions, the atmospheric concentrations of NO and NO2 are low (on the order of a few ppb).
VOC have variable lifetimes ranging from a few hours (e.g., aldehydes) to a few days (e.g., benzene). In addition, the oxidation of a VOC with several carbon atoms will occur over several oxidation steps and will, therefore, last for some time. Also, VOC emissions are both anthropogenic (urban areas, industrial sites …) and biogenic (rural areas, forests). Therefore, although VOC concentrations can be high near major sources (e.g., in urban areas because of on-road traffic), they are rarely negligible given the diverse lifetimes of VOC and their oxidation products as well as the spatial distribution of their emissions. Given these general patterns on the atmospheric concentrations of NOx and VOC, one may assume that the atmosphere is generally high-NOx in urban areas, near major traffic routes (shipping, on-road, and air traffic), and near some industrial sites and is generally low-NOx in rural areas. However, some urban areas and industrial sites may have important VOC concentrations, for example, if the surrounding biogenic emissions are important. Thus, we may have specific cases with high VOC regimes (relatively to NOx) in some urban areas and industrial sites.
8.5.2 Strategies to Reduce Ozone Precursor Emissions
It is important to identify the chemical regime of ozone formation, because it affects the efficiency of various strategies available for reducing the emissions of ozone precursors. Let us consider the two cases described in Section 8.5.1: low-NOx regime and high-NOx regime.
Low-NOx Regime
NOx emissions consist mostly of NO and include little NO2 (<10 % except for some diesel vehicles with catalytic particle filters, see Chapter 2). If one reduces NOx emissions (i.e., mostly NO concentrations), one reduces the formation of NO2 by oxidation of NO by peroxyl radicals and, therefore, O3 formation by photolysis of NO2. Indeed, Equation 8.48 shows that O3 formation is proportional to the NO concentration. In a low-NOx regime, a reduction of the NOx emissions is efficient to reduce O3 concentrations.
If one reduces VOC emissions (i.e., VOC concentrations), one reduces the production of peroxyl radicals and, therefore, O3 formation. However, although the production of peroxyl radicals decreases, their concentration does not decrease proportionately because they are consumed via two different reactions pathways: (1) their reaction with NO (which is proportional to their concentration) and (2) their self-reaction, which leads to the formation of peroxides (see Figure 8.10) and is proportional to the square of their concentration. The kinetics of the second consumption pathway decreases, therefore, faster than their production rate and, as a result, their concentration decreases proportionately less than the VOC concentration. The O3 formation rate given by Equation 8.48 depends on VOC emissions only via the production of HOx radicals (PHOx), i.e., aldehyde photolysis, which implies that VOC emissions have little effect on ozone production. In addition, alkenes react with O3 (see Section 8.3.6) and if their concentrations are important, a decrease of their concentration may lead to less O3 consumption and, therefore, a small increase in O3 concentrations. A VOC reduction strategy in a high-VOC regime (i.e., low-NOx regime) is not very efficient to reduce O3 concentrations.

Figure 8.10. Schematic representations of ozone chemistry in a low-NOx regime (top figure) and a high-NOx regime (bottom figure). VOC: volatile organic compound, OVOC: oxidized volatile organic compound. NO, NO2, and O3 are involved in the Leighton photostationary-state reactions, and the directions of the arrows indicate the main effect of the change in NOx emissions on the O3 concentration for each regime.
High-NOx Regime
If NOx concentrations are high compared to VOC concentrations, the production of peroxyl radicals by VOC oxidation will be relatively low and will, therefore, have only a small effect on the Leighton photostationary state. Therefore, if NOx emissions are reduced (i.e., mostly NO concentrations), the consumption of O3 by NO will be reduced (since the NO/NO2/O3 cycle is not influenced much by peroxyl radicals in that case) and there will be an increase in the O3 concentration. In addition, in a high-NOx regime, the termination of the O3 formation cycle occurs mostly by reaction of OH radicals with NO2 (since the NO2 concentration is high compared to the VOC concentration, see Figure 8.10). A decrease in NOx concentrations (i.e., a decrease in the NO2 concentration), implies that there will be a greater availability of OH radicals to react with VOC and produce peroxyl radicals, thereby favoring the oxidation of NO into NO2 and O3 production. This analysis is consistent with the inverse relationship between the O3 formation rate (PO3) and the NO2 concentration of Equation 8.55. In a high-NOx regime, a reduction of NOx emissions has an antagonistic effect leading to an increase of the O3 concentrations.
On the other hand, a reduction of VOC emissions (i.e., a reduction of VOC concentrations), leads to a reduction of peroxyl radicals and, therefore, a reduction in O3 formation. This is consistent with the proportional relationship between the O3 formation rate (PO3) and the VOC concentration of Equation 8.55. Therefore, an efficient strategy to reduce O3 concentrations in a high-NOx regime (i.e., a low-VOC regime) is to reduce VOC emissions.
Design of Emission Control Strategies
In summary, an efficient strategy to reduce ozone concentrations must focus on the reduction of the precursor (NOx or VOC) that has the lower atmospheric concentration and is, therefore, limiting for O3 formation. A reduction of the emissions of the precursor that has the higher atmospheric concentrations may not be efficient and may even be counterproductive because it may lead to an increase of the O3 concentration. Figure 8.10 depicts these two regimes with the main termination reactions: peroxide formation in a low-NOx regime and nitric acid formation in a high-NOx regime. These mechanisms imply that it is possible to determine experimentally whether the O3 concentrations measured in the atmosphere have been formed under a low-NOx or high-NOx regime (Sillman, 1995). For example, one only needs to measure the HNO3 and H2O2 concentrations. If the [HNO3]/[H2O2] ratio is high, then O3 has been formed under a high-NOx regime. If this ratio is low, O3 has been formed under a low-NOx regime. It is then possible to determine which emission reduction strategy will be the most efficient to reduce O3 concentrations.
EKMA (« Empirical Kinetic Modeling Approach ») diagrams have been developed in the U.S. to provide simple information to help develop efficient emission reduction strategies to reduce O3 concentrations. They are developed based on simulations of the atmospheric chemistry of O3. These simulations may use simple or advanced atmospheric chemistry models. Initially, they were based on trajectory model simulations, i.e., a box-model that follows a mean wind trajectory. An ensemble of simulations was conducted with different VOC and NOx emission levels, to construct a diagram such as the one presented in Figure 8.11. This diagram highlights the two chemical regimes: high-NOx in the top left part of the figure and low-NOx in the bottom right part. In the high-NOx case, a reduction of NOx emissions leads toward isopleths corresponding to higher O3 concentrations and a reduction of VOC emissions is required to reduce O3 concentrations. In the low-NOx case, a reduction of VOC emissions is not very efficient, because the change in O3 concentrations is nearly parallel to the O3 isopleths. On the other hand, a reduction of NOx emissions leads toward isopleths corresponding to lower O3 concentrations. A [VOC]/[NOx] ratio, expressed as (ppb C)/(ppb NOx), of about 8 is typically considered to be the limit between the high-NOx and low-NOx regimes.

Figure 8.11. Isopleth diagram of O3 concentrations as a function of VOC and NOx emissions. It is also known as an EKMA diagram, where EKMA stands for “Empirical kinetic modeling approach.” A reduction of VOC emissions leads to lower O3 concentrations in a high-NOx regime (i.e., low-VOC regime), whereas a NOx emission reduction is more efficient in a low-NOx regime. Reducing NOx emissions in a high-NOx regime leads to an increase in O3 concentrations.
Figure 8.12 shows this type of information obtained for the Paris region with a more comprehensive model than those typically used for EKMA diagrams. The Polyphemus numerical model used here is a three-dimensional model that includes all relevant atmospheric emissions, transport, dispersion, transformation, and deposition processes. The limit between the high-NOx and low-NOx regimes is located beyond the downtown Paris area. A simulation conducted with a 15 % reduction in NOx emissions shows an increase in O3 concentrations in the Paris urban area, which corresponds to the high-NOx regime. On the other hand, a simulation conducted with a 15 % reduction in VOC emissions leads to a significant reduction of the O3 concentrations within the Paris urban and suburban areas, but negligible reductions in the surrounding rural areas where the low-NOx regime does not favor VOC emission reductions.

Figure 8.12. Influence of NOx and VOC emissions on O3 in the Paris region. Top figure: VOC/NOx atmospheric concentration ratio for the Paris region (the dotted line corresponds to [VOC]/[NOx] = 8 mole C/mole NOx). Changes in O3 concentrations in μg m−3 (average from May to September 2005 of the maximum daily 8-h average O3 concentrations) due to emission reductions over the Paris region: 15 % NOx reduction (middle figure) and 15 % VOC reduction (bottom figure). The VOC/NOx ratio and changes in O3 concentrations are indicated on the right vertical axis. Latitude (°N) and longitude (°E) are indicated on the left vertical axis and horizontal axis, respectively. All simulations were performed with the Polyphemus numerical model.
8.5.3 Ozone Formation Potentials of VOC
VOC differ significantly in terms of their chemical reactivity and, therefore, in terms of their potential to form ozone. The lifetimes presented in Table 8.1 provide useful information concerning the oxidation kinetics of selected VOC. Such information is relevant to their potential to form ozone in the presence of sunlight and NOx. However, the products of these oxidation reactions also affect ozone formation and the kinetics of the first oxidation step (called kinetic reactivity) is not sufficient to estimate the ozone formation potential of a VOC. The number of ozone molecules formed per VOC molecule that has been oxidized gives some information on the potential of that VOC to form O3. However, this measure of the ozone formation potential (called mechanistic reactivity) does not account for the time needed to form O3, which is important in the atmosphere where transport and deposition processes must also be taken into account. Note that this mechanistic reactivity differs from the theoretical ozone yields mentioned in Section 8.3 for some VOC (for example, two O3 molecules per molecule of formaldehyde being oxidized or photolyzed), because the chemistry of a VOC depends on other chemical species present in the atmosphere, which in turn are influenced by the VOC being studied.
Therefore, one should see these two approaches (mechanistic reactivity and kinetic reactivity) as complementary, one providing valuable information on the amount of O3 that will eventually be formed and the other indicating the time needed to form O3. Thus, it is appropriate to use a metric of the ozone formation potential that combines these two reactivity concepts. To that end, one may estimate the amount of O3 formed per molecule (or mass) of VOC added to a mixture of VOC and NOx. This metric is called the incremental reactivity, because one measures the VOC reactivity in terms of its increment of ozone formation. There is no unique definition for this type of ozone formation potential, because (1) it depends on the conditions under which it has been estimated (e.g., mixture of VOC being used, relative amounts of VOC and NOx, and duration of the simulation or experiment) and (2) the amount of O3 formed can be defined in several ways (maximum concentration, concentration averaged over a certain period, etc.).
Three main metrics of ozone formation potentials that are commonly used may be mentioned: Maximum Incremental Reactivity (MIR), Maximum Ozone Incremental Reactivity (MOIR), and Equal Benefits Incremental Reactivity (EBIR). These different metrics give different values for the ozone formation potential, but they are rather similar in terms of the reactivity of a specific VOC relative to those of the other VOC. MIR is used here to illustrate this concept of ozone formation potential. “Maximum” refers to the fact that the experiment is conducted under high-NOx conditions for which the formation of O3 from a VOC is optimal. The estimation of the MIR of a VOC depends on the mixture composition, the sunlight conditions (photolysis rates), and the duration of the simulation or experiment. Nevertheless, once those conditions have been set, it is possible to estimate in a consistent manner the MIR of a large number of VOC under conditions that approximate rather well those observed during air pollution episodes. The estimation of MIR can be conducted either experimentally (in smog chambers) or via numerical simulations using a chemical kinetic mechanism, which has been previously evaluated satisfactorily against smog chamber data (see Section 8.6).
Figure 8.13 shows some results obtained with MIR estimated using simulations conducted with the SAPRC-07 mechanism (Carter, 2010). A simulation time of a few hours and a high-NOx mixture ([VOC]/[NOx] = 3.7) including VOC representative of an urban area were used for these simulations. There is good agreement between the MIR scale and the rate constants of the OH reaction for some species (for example, for the biogenic compounds). However, there are significant differences for most of the other species. For example, the alkane MIR values are similar, whereas their OH reaction kinetics are nearly proportional to their number of carbon atoms (see Figure 8.2). Furthermore, toluene and xylene have MIR values similar to those of the biogenic compounds, despite having much lower OH reaction rate constants. These results highlight the importance of mechanistic reactivity as a complement to kinetic reactivity. According to the results presented in Figure 8.13, the most reactive VOC in terms of O3 formation are the alkenes (including biogenic compounds), the aromatic compounds (except for benzene), and the aldehydes. We will see in Chapter 9 that one obtains different results when VOC reactivity is considered in terms of secondary organic particulate matter formation.

Figure 8.13. Maximum incremental reactivity (MIR) and oxidation kinetics of selected VOC. MIR, here in number of moles of O3 formed per mole of VOC added to the initial mixture, obtained by numerical simulation using the SAPRC-07 chemical kinetic mechanism (in black), left scale, and rate constant of the OH reaction (in gray), right scale.
8.6 Numerical Modeling of the Gas-phase Chemistry of Photochemical Air Pollution
The simulation of ozone formation is performed with a chemical kinetic mechanism that represents the major chemical reactions involved. The number of inorganic reactions among different nitrogenous species (NOy), CO, and oxidants (O3, OH, HO2 …) is limited and it is, therefore, possible to include all these reactions in an exhaustive manner. On the other hand, that is not the case for VOC, because (1) they are emitted in large numbers as primary species and (2) they lead to even larger numbers of secondary species via successive oxidation steps. Chemical kinetic mechanisms that represent explicitly the chemical reactions of very large numbers of VOC have been developed, such as MCM (Saunders et al., 2003; Bloss et al., 2005) and GECKO-A (Aumont et al., 2005). However, the use of such mechanisms, which include thousands of chemical species and reactions, in operational air pollution models (which must include, in addition to chemical reactions, emissions, transport, dispersion, solar radiation, and deposition) has been limited because of the overwhelming computational times involved. It is, therefore, necessary to reduce the size of the organic chemical mechanism in terms of numbers of species and reactions. To that end, two major approaches have been developed and applied.
– Use of surrogate organic molecules
– Decomposition of the organic molecules into functional groups
The first approach consists of assuming that organic molecules that have similar formulas and properties will behave chemically similarly. For example, alkanes containing a few carbon atoms will have similar kinetics and similar oxidation products. Of course, the oxidation kinetics of propane, butane, and pentane are different. Nevertheless, one may define a surrogate molecule that is representative of these three species and has a kinetics obtained by weighing the kinetics of these three species (the weighing can be performed using the ambient concentrations or the emission rates of these three species for the area being studied). The two mechanisms of this kind that are the most widely used are RACM (Regional Atmospheric Chemistry Mechanism) and SAPRC (Statewide Air Pollution Research Center). The most recent versions are RACM 2 (Goliff et al., 2013) and SAPRC 07 (Carter, 2010). The advantage of this approach is that it represents the evolution of chemical molecules well. The disadvantage is that it does not conserve mass, since molecules with different numbers of carbon atoms are lumped into a single surrogate molecule. In addition, the rate constants of the reactions of this surrogate molecule are defined by weighing relative amounts of the molecules being represented by this surrogate molecule. Since these relative amounts depend on the local emission inventory, they are likely to vary among different areas, as well as in time (for example, a strategy for VOC emission reductions may not affect all VOC in the same way).
The second approach consists of breaking a molecule into its functional groups and making the assumption that its chemical behavior is equivalent to the chemical behaviors of its functional groups. For example, an alkene with four carbon atoms will be broken down into a group of two carbon atoms with a double bond (which will follow alkene chemistry) and two groups containing each one carbon atom with single bonds (which will follow alkane chemistry). These mechanisms are called “carbon-bond” mechanisms. Some recent versions include CB05 (Yarwood et al., 2005) and CB05-TU (with a modified toluene chemistry; Whitten et al., 2010). The advantage of this approach is that it conserves carbon mass, since carbon mass is defined exactly in the various functional groups. In addition, it is independent of the emission inventory and a carbon-bond mechanism is applicable to any region or period as is. The disadvantage is that breaking down molecules into functional groups loses the molecular structure and, therefore, the evolution of the VOC molecule cannot be followed clearly over several oxidation steps. In particular, the formation of semi-volatile organic compounds (SVOC), which is important for the formation of secondary organic aerosols (SOA, see Chapter 9), cannot be represented by a carbon-bond mechanism, because the number of carbon atoms of the initial molecules is lost during the decomposition into functional groups. Then, some chemical reactions specific to SOA formation must be added to a carbon-bond mechanism.
These chemical kinetic mechanisms are developed based on available mechanistic and kinetic data. In addition, they are evaluated with experimental data obtained in smog chambers and, if needed, they are modified to improve the agreement with the experimental data. The two approaches presented include simplifying assumptions and offer advantages and shortcomings (Dodge, 2000). Comparisons of different chemical kinetic mechanisms that are commonly used have been conducted. For O3 formation, these two distinct approaches lead to similar results, with differences that are small when compared to other sources of uncertainties (e.g., Kim et al., 2009). The set of ordinary differential equations that represents the chemical kinetic mechanism is numerically stiff, and they must be solved using an appropriate numerical algorithm (see Chapter 7).
The simulation of ozone formation requires to take into account emissions, transport by the mean wind, dispersion, and deposition of air pollutants, in addition to their chemistry. Such simulations are conducted using three-dimensional (3D) chemical-transport models based on the atmospheric diffusion equation (see Chapter 6). The first 3D chemical-transport model for photochemical smog was developed for the Los Angeles Basin in California by Reynolds et al. (1973). Some of the current chemical-transport models are mentioned in Chapter 15.
Problems
Problem 8.1 Chemical kinetics
a. The rate constant of the oxidation of heptane (alkane with seven carbon atoms) by OH radicals is 6.5 × 10⁻¹² cm3 molecule−1 s−1 (or cm3 radical−1 s−1). If [OH] = 2 × 10⁶ radicals cm−3, what is the half-life of heptane?
b. What is the lifetime (also called residence time) of heptane for this same reaction?
c. Will the half-life of cetane (an alkane with 16 carbon atoms) be longer, shorter or similar? Explain why.
Problem 8.2 Reduction of tropospheric ozone of photochemical smog
a. Measurements conducted in an urban area give atmospheric concentrations of volatile organic compounds (VOC) of 120 ppb C and concentrations of nitrogen oxides (NOx) of 30 ppb. The emission ratio of VOC and NOx is (in moles of C and moles of NOx) VOC/NOx = 3. One assumes that the limit between a low-NOx regime and a high-NOx regime is VOC/NOx = 8. Which precursor category (NOx or VOC) should be reduced to decrease ozone concentrations in an optimal manner?
b. Why is the VOC/NOx ratio of the emissions different from that of the concentrations?
c. In a different urban area, measurements of hydrogen peroxide (H2O2) and nitric acid (HNO3) are available. There is more of the former (H2O2) than of the latter (HNO3), i.e., [H2O2]/[HNO3] ≫ 1. To decrease the ozone concentration, which precursor emissions should be reduced?
Problem 8.3 Nitrogen dioxide concentrations
Concentrations of nitrogen dioxide (NO2) near a roadway have remained nearly constant in the Paris region from 2009 to 2015, while the emissions of nitrogen (NOx) have decreased significantly during the same period. Explain the reason(s) for this phenomenon.
Problem 8.4 Chemical mechanism
In a CB05 carbon-bond mechanism, two carbon atoms with a double bond (C=C) are represented by “OLE,” one carbon atom with single bond (–CH2– or –CH3) is represented by “PAR,” and an aldehyde group (-CHO) is represented by ‘FORM.” Write the CB05 formulation for 1-hexene (H2 C=CH-CH2-CH2-CH2-CH3).