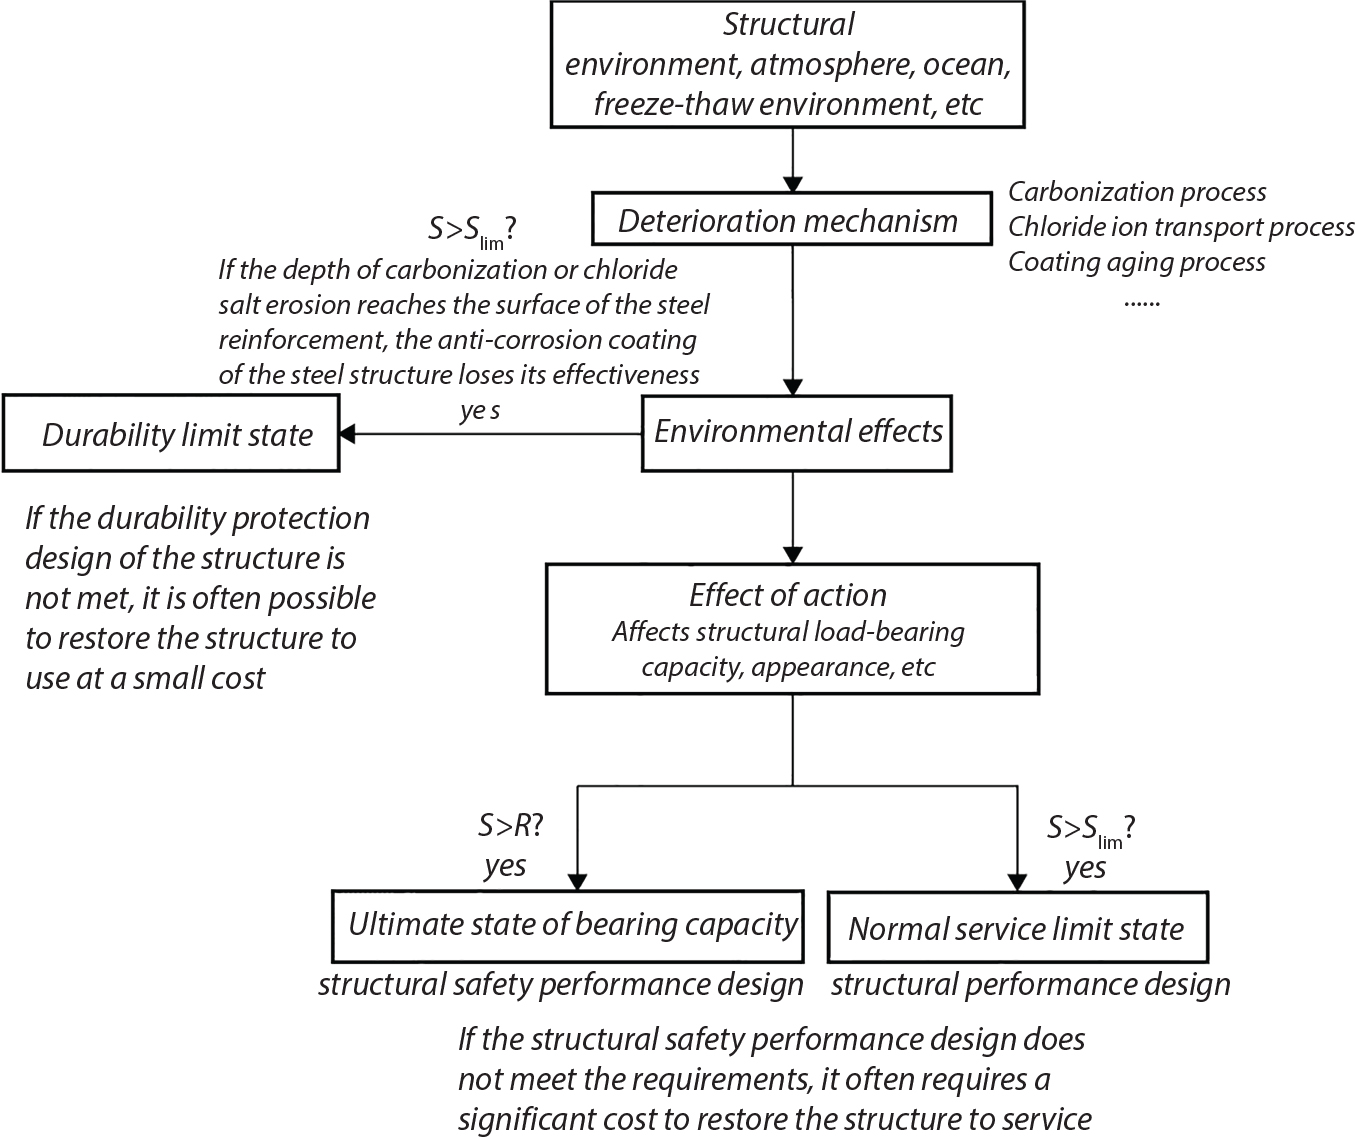
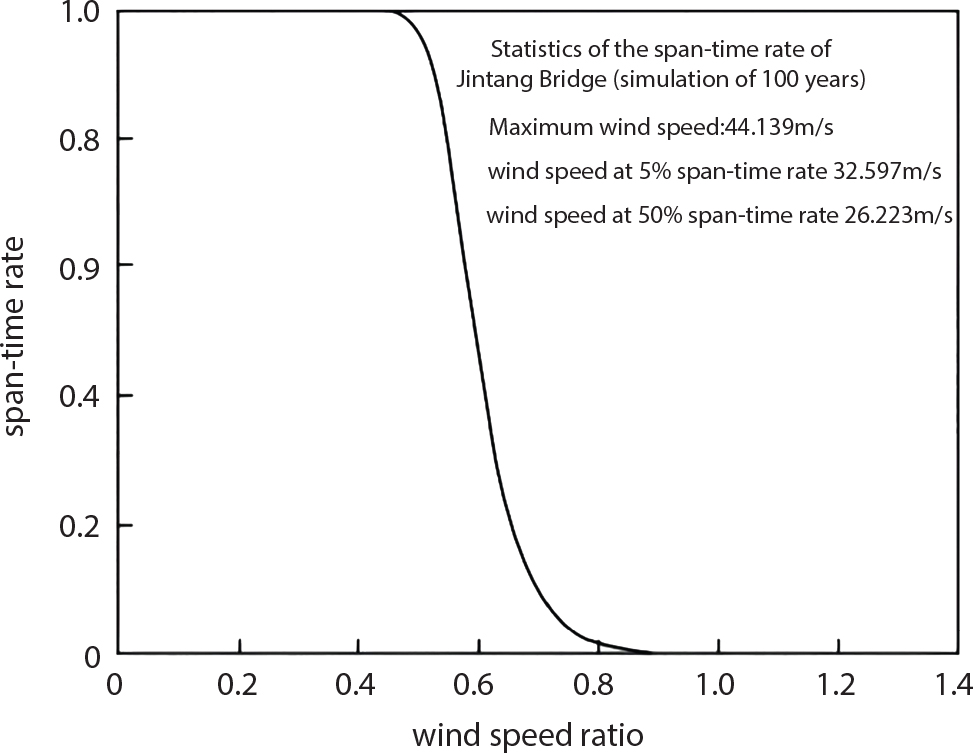
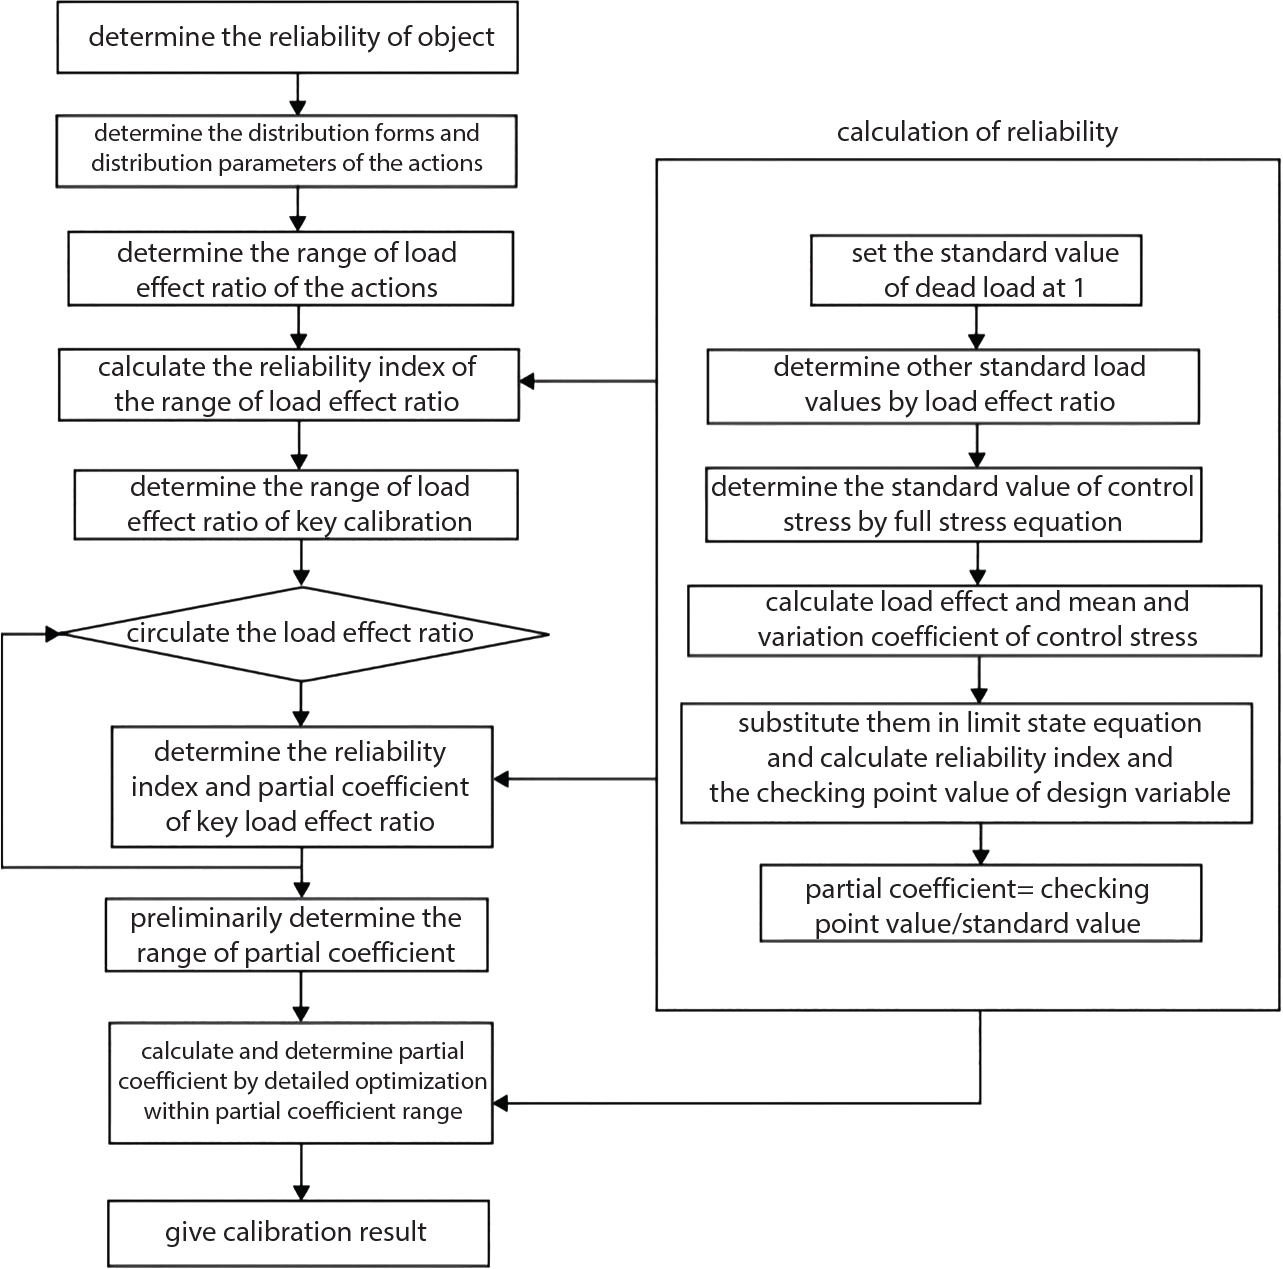
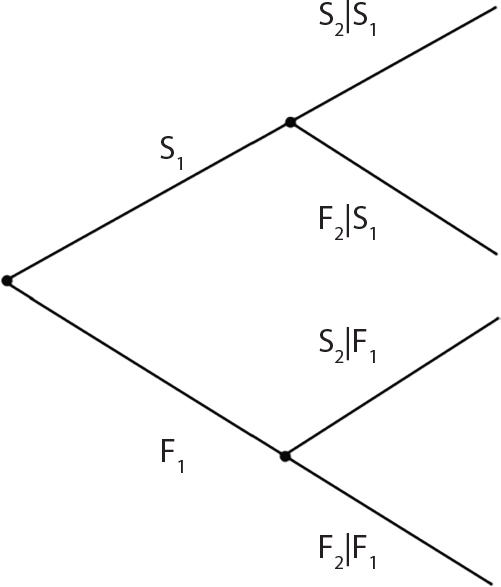
Since the 1970s, the theory of structural reliability based on probability theory and mathematical statistics has gradually ushered in a period of practical application in the international civil engineering industry. In 1975 and 1979, Canada took the lead in issuing reliability-based design codes for building and highway bridge structures [8-1][8-2]. In 1977, the Federal Republic of Germany compiled the Basis for Confirming Building Safety [8-3] as the foundation for the compilation of other codes. In 1980, the American National Standards Institute (ANSI) issued Probability-based Load Criteria [8-4]. In 1982, the UK [8-5] added the theory of structural reliability to the BS5400 Bridge Design Code. This shows that the theory and method of structure design in civil engineering have marked the dawn of a new era. China did not start carrying out research on the theory and application of structural reliability in the field of construction until the mid-70s. In 1984, the State Development Planning Commission approved the implementation of the Unified Standard for the Design of Building Structures (GBJ 68-84) [8-6]. This standard contains unified principles for probabilistic limit state design based on reliability. Later, referencing the International Standard of General Principles of Structural Reliability (ISO2394)[8-7], based on China’s practical engineering experience, and after soliciting opinions from the national departments concerned, the country compiled a unified standard for engineering structure reliability design [8-8][8-9][8-10][8-11][8-12] pertaining to architecture, water conservancy, water transport, highways and railway construction. These codes were all theoretically based on structural reliability theory, while the probabilistic limit state expressed by partial coefficients was adopted as the main criterion for the revision of the structural design codes. Under the guidance of the “Unified Standard”, structural design codes for architecture, water conservancy, transportation and railway construction were revised or compiled on a massive scale. This was known as the “transformation” of codes in the engineering sector, i.e., the experience-based safety factor method was transformed into a probability analysis-based limit state design method. After a lot of hard work, a general national standard, the Unified Standard for Reliability Design of Engineering Structures (GB 50153-92), was officially released in 1992 [8-13]. In the early days, the deterministic allowable stress analysis method (WSD) was adopted for the design of engineering structures. As human understanding of objective things deepened, and as reliability theory continued to develop, it became necessary to consider the uncertainty of things in design. Therefore, the resistance and partial coefficient design method (LRFD), which also considered the uncertainty of events, was thought of as a more reasonable design method and therefore accepted by most designers. The core problem of LRFD is how to reasonably determine partial coefficients for different kinds of loads in combination. This method can be used to build a correlation between the target reliability index and load partial coefficients so that the target reliability can be reflected in the design process. It is necessary to determine the reliability index of engineering structures, and then to calculate the partial coefficients according to the determined reliability index. As is explicitly stipulated in the new “Unified Standard”, the basic function of load effect should be considered in the process of bearing capacity limit state design, and the combination of loads must be considered when necessary. Three types of effect combinations can be selected in the process of normal serviceability limit state design. These are standard combination, frequency combination and quasi-permanent combination. Different load combinations produce different partial coefficients for loads and resistance. Therefore, load combination, which extends throughout the entire “unified standard”, is both its foundation and core content. After many years of theoretical research and engineering practice, the unified standard for reliability design has developed to varying extents with respect to professional fields. The corresponding code system has also undergone changes along with the transition from understanding structural reliability to applying structural reliability. During 2006 and 2014, the Unified Standard for Reliability Design of Engineering Structures (GB 50153) [8-14][8-15] was officially published. In 2019, the latest Unified Standard for Reliability Design of Building Engineering Structures (GB50068-2018) [8-16] was implemented. The following contents were modified in the new code. (1) The level of structural safety was adjusted; the value of related partial coefficients was improved, and for basic combinations of loads, that combination where permanent load plays a controlling role is eliminated; (2) the conditions for anti-quake design were added to the new code; for anti-quake architectural structure design, the design idea that “the structure is unbreakable in minor earthquakes, repairable after middle earthquakes and indestructible in severe earthquakes” was introduced; (3) the regulations on the reliability evaluation of existing structures were improved; (4) relevant regulations on overall structural stability design were added; and (5) relevant regulations on structural durability limit state design were added. The most critical modification in terms of structural design was as follows: the partial coefficient of dead load was adjusted from 1.2 to 1.3, while the partial coefficient of live load was adjusted from 1.4 to 1.5. Structural design codes are formulated based on meeting structural functional requirements. The safety, serviceability and durability required by structural reliability are the basic functions that a structure must possess. Structural reliability is a criterion for the establishment of various design codes. At present, the design methods in international structural probability are divided into three levels, depending on accuracy: Level I, Level II and Level III. (1) Level I—Semi-probability design method Although the design method at this level considers probability in terms of load and material strength, since it considers load and resistance separately, and does not consider structural reliability from an overall perspective of structural components, the core of structural reliability—structural failure probability—remains untouched. Moreover, each partial safety factor is primarily determined based on engineering experience; hence it is known as the semi-probability design method. (2) Level II—Approximate probability design method This is a probability design method that has already been put into practice all over the world. Based on probability theory and mathematical statistics, it makes a relatively approximate estimation of “reliability probability” for the design of engineering structures, components or sections. Under China’s unified standard, the probability theory-based first-order second-moment limit state design method is a method at this level. Although it is already a probability method, the time-dependent change of basic variables is ignored or simplified during analysis; it features considerable approximation because it is restricted by existing information when used to determine the distribution of basic variables; moreover, some complex nonlinear limit state equations are linearized in order to simplify the design calculation, so it is still only an approximate probability method. But at the present stage, it is indeed a reasonable and feasible method for handling structural reliability. (3) Level III—Total probability method The total probability design method is an ideal method that is based on probability theory. It not only describes various factors affecting structural reliability by means of a random variable probability model, but also considers time-varying characteristics and describes them via a random process probability model. Moreover, based on accurate probability analysis of the whole structural system, the structural failure probability is taken as the direct measurement of structural reliability. It is a real and complete probability method. At present, this is just a field of research worth exploiting, it will take a long time to realize any practical use. Of the last two levels, Level II approximates Level III. From Level III, we can derive an optimal total probability method based on the optimization theory. At present, the probabilistic reliability design method is the one used in most codes. Its basic design principle is as follows: within the specified time (design reference period), the structure can satisfy specific functions (durability, serviceability and safety) under various environmental loads. The design reference period is a time parameter used to determine variable loads and time-dependent material properties. Design conditions are divided into three types: durable, transient and accidental. Structural design should ensure that the relevant functional requirements are met under these conditions. The general requirements [8-17][8-18][8-19] for structural design are as follows: Structural resistance R should not be less than the comprehensive structural load S. See below Because the structural resistance and load effect are, in practice, both random variables, the above equation cannot be strictly satisfied, and can only be satisfied in a certain probabilistic sense, i.e., where PS represents structural probabilistic reliability. Therefore, structural design helps to ensure that structural resistance is greater than or equal to structural load under a certain reliability condition. The most important function of an engineering structure is its ability to withstand various environmental actions that may occur during its use. Various forces directly acting on a structure caused by different environmental factors are called loads. The loads acting on the structure cause internal forces and structural deformation (called load effect). The purpose of structural design is to ensure that the bearing capacity of the structure is large enough to resist internal forces, so that the deformation is controlled within the scope of normal structural use. During structural design, it is necessary to consider not only the various loads acting directly on the structure, but also indirect factors causing internal forces and structural deformation. The factors that can cause structural effects are called actions [8-20]. (1) According to time-dependent variability, the environmental actions on the structure can be classified into: Because the variability of a variable action is greater than that of a permanent action, its relative value should be greater than that of a permanent action, too. Owing to the small probability of accidental action, the reliability of the structure resisting accidental action is lower than its reliability against permanent and variable actions. (2) According to the variability of spatial position, the environmental actions on the structure can be classified as: (3) Classification by structural response: For dynamic actions, structural dynamic effects must also be considered. The structure has to be analyzed by a dynamic method, or if the dynamic action is transformed into an equivalent static action, then the structure can be analyzed by a static method. The reliability that must be ensured during structural design is known as the target structural reliability [8-21]. This has a significant influence on structural design. If the target reliability is slightly higher, then the structure will be stronger, but the cost will increase; if the target reliability is on the low side, the structure will be a bit weak, causing insecurity. Thus, for the determination of target structural reliability, it is necessary to fully consider the balance between structural reliability and economic benefits. In general, the following factors need to be considered: (i) public psychology; (ii) structural importance; (iii) structural destructibility; (iv) economic bearing capacity of society. For important structures, the target reliability should be a little higher; for minor structures, the target reliability can be a bit lower. In many countries, engineering structures are divided into three levels, in order of importance: important structures, general structures and minor structures. Normally, the target reliability of general structures is taken as the basis for design, and for an important structure, its failure probability is decreased by one order of magnitude, while for a minor structure, its failure probability is increased by one order of magnitude. For a brittle structure, there is almost no warning before it fails, and the consequences of its failure are more serious than those of a ductile structure. Therefore, it is generally requested in engineering practice that the target reliability of brittle structures should be higher than that of ductile structures. The economic bearing capacity of society also has a certain influence on the target reliability of engineering structures. The more developed the social economy, the higher the public requirements for reliability of engineering structures, and the higher the target reliability. The major methods for determining target reliability are as follows: accident analogy, economic optimization and empirical calibration. According to the structural safety class and failure type, the target reliability index [β] for bearing capacity limit state design is specified in the Unified Standard for Reliability Design of Building Structures [8-9] shown in Table 8.1. Failure structures and structural components are divided into two types: ductile failure and brittle failure. Ductile failure be preceded by an obvious warning sign, so remedial measures can be taken in time. Therefore, the target reliability index can be set slightly lower. Brittle failure is usually a sudden kind of failure, with no adequate warning. As a result, the target reliability index should be set higher. When the reliability index β is used for structural and reliability checking [8-17][8-18], the objective variability of factors influencing reliability can be taken into full consideration, enabling the structure to meet its expected reliability requirements. For empirical calibration, the reliability method is used to perform an inverse analysis of the original structural design code to identify the reliability level implied in the original structural design code. On this basis, all factors are then taken into consideration to determine the target reliability. The steps involved are as follows: (1) determine the standard value of the resistance of components; (2) determine the mean value, standard deviation and distribution type of various basic variables; and (3) determine the reliability index by means of the JC method. In engineering practice, the load effect is often a combination of two or more loads. Moreover, the load effect does not necessarily obey normal or lognormal distribution, while the limit state equation of the structure may also be nonlinear. At this point, the structural reliability needs to be calculated by the checking point method according to the iterative model. The solution steps are as follows: (1) determine the limit state equation; (2) set the initial value of random variables; (3) transform normal and non-normal random variables into standard normal random variables; and (4) substitute the reliability index and random variables into the equation, and perform an iterative calculation using the checking point method until the results converge, with all checking point coordinates obtained. Table 8.1 Target reliability index of current building structures in China. Structural functional requirements are divided into three aspects in the Unified Standard of Reliability Design of Engineering Structures (GB50153 [8-15]): safety, serviceability and durability. Structural safety means that within its service life, a structure should be able to bear various loads, imposed deformation (e.g., the differential settlement of the bearings of statically indeterminate structures) and constrained deformation (e.g., when temperature or shrinkage is constrained) which may occur during normal construction and normal use. When and after an accidental event (e.g., an earthquake or explosion) occurs, the structure should be able to maintain its overall stability, and shall not collapse or suffer continuous damage, resulting in a great loss of life and/or property. As the most important quality index of structural engineering, safety mainly depends on the level of structural design and construction. It is also related to the correct use (maintenance and inspection) of the structure. All these factors are related to the reasonable formulation and correct use of civil engineering laws and technical standards. For the design of an engineering structure, structural safety is primarily reflected in the security of the bearing capacity of structural components and the overall firmness of the structure. Structural serviceability means that a structure should maintain a good working performance during normal use. For example, excessive deformation (deflection, lateral displacement) or vibration (frequency, amplitude) should not occur during normal use, or an excessively wide crack that may make the user feel uneasy should not appear. The Code for Design of Concrete Structures (GB50010-2010) requires that serviceability should primarily be achieved by controlling deformation and crack width. For the limit of deformation and crack width, the structure must be subjectively acceptable to the user except where the structural functional requirements need to be met to protect the structural components and non-structural components against all adverse actions. Structural durability refers to the ability of a structure to permanently resist performance degradation under proper maintenance conditions within its pre-defined service life when it is used under the influence of various actions that may cause a change in its performance (loads, environment, internal factors of materials, etc.). As can be seen from the concepts of structural safety, serviceability and durability, they all have specific connotations. Structural safety is the ability of a structure to resist various loads; structural serviceability means a good and suitable working performance, with both primarily representing structural functional issues. Structural durability refers to the ability of a structure to resist performance deterioration caused by long-term loads (environmental, cyclic loads, etc.). Durability problems exist throughout the whole service life of a structure and have an impact on structural safety and serviceability. They are the most fundamental cause for the degradation of structural performance. Figure 8.1 Limit state of structural design. Therefore, the durability limit state has been newly added to the Unified Standard for Reliability Design of Building Structures (GB50068) [8-16], where it is listed as an essential requirement for structural design, along with the bearing capacity limit state and the serviceability limit state. Actually, the durability limit state (i.e., the condition limit state described in ISO 2394, and the initiation limit state described in ISO 13823), serviceability limit state and bearing capacity limit state are also equally specified in the international standards General Principles of Structural Reliability [8-21] (ISO 2394-2015) and General Principles of Structural Durability [8-22] (ISO 13823-2008). Obviously, the durability limit state occurs before the serviceability limit state, and is one of the control conditions for structural design. Figure 8.1 provides a schematic diagram of the three limit states related to structural design at different stages. According to the probabilistic limit state design theory, there exist partial coefficients for loads (including dead load and variable load), as well as resistance partial coefficients in the engineering limit state design expression [8-17]. The material properties, coefficients of variation of geometric parameters and the uncertainty of the resistance calculation model in the design expression are all included in the resistance partial coefficients. The uncertainty of the load calculation model is also included within the load partial coefficients. The purpose of determining design partial coefficients is to implement the target reliability index of the engineering structure to each partial coefficient in the limit state design expression, so that complex numerical operations of probability limit states can be converted into a simple algebraic operation. From experience, for the same structural component, when the load-effect ratio, i.e., the ratio between variable load effect and dead load effect, changes, the reliability index changes drastically, indicating poor consistency of the reliability. The reason is that the difference of variable load is greater than that of the dead load. So, when variable load occupies the dominant position, the reliability of structures designed by the same design expression decreases. If a multi-coefficient expression is adopted, the structural reliability will have good consistency. Therefore, the partial coefficient design method is proposed in order to overcome the shortcomings of the single coefficient design method. By this method, we can decompose the safety factor in the single coefficient design expression into load partial coefficients and resistance partial coefficients, so that each load adopts its own partial coefficient when the load effect is caused by multiple loads [8-23]. The general form of the partial coefficient design expression is as follows where The design expression in the form of Equation (8.3) has excellent applicability, and can be used to study various factors affecting structural reliability separately. Different load partial coefficients can be adopted according to the variability of the loads. However, different numeric values can be assigned to resistance partial coefficients according to the working performance of the structural materials. Considering that different countries adopt different methods to determine the standard value of load and resistance, there is also a difference in the level of target reliability. Therefore, different values are assigned to partial coefficients in the structural design expression in different countries. For each country, the load partial coefficients and resistance partial coefficients are used together with the standard value of load and the standard value of resistance. As a whole, in the design expression, they have precise probabilistic reliability significance. It is not allowed to use a certain country’s design expression for structural design with another country’s standard value of load or standard value of resistance. If any of the following events occurs to a structure or a structural component, it shall be confirmed that the structure or structural component has exceeded its bearing capacity limit state: (1) the structural component or connection is damaged because it has exceeded its material strength, or it cannot continue to bear loads due to excessive deformation; (2) the whole structure or part of it is out of balance as a rigid body; (3) the structure is transformed into a maneuvering system; (4) the structure or structural component is unstable; (5) the structure gradually collapses due to local damage; (6) the bearing capacity of the foundation is weakened; and (7) the structure or structural component suffers from fatigue failure. For the bearing capacity limit state, structural design is carried out according to the following design expression: where γ0 is the factor for importance of the structure and is shown in Table 8.2; S is the designed value of the load effect combination; R is the designed value of the resistance of structural components and can be determined according to the code for the design of the relevant structure. The general expression for the designed value S of load effect combination is as follows Table 8.2 Factor for importance of structure γ0. When the permanent load effect is bad for the structure, its partial coefficient is set to 1.3; in general, the partial coefficient for variable load is set to 1.5. when the permanent load effect is good for the structure, its partial coefficient is set to 1.0, but to 0.9 for checking for overturning, slippage or floatation of the structure; the partial coefficient for variable load is generally set to 0.0. Load adjustment coefficient of service life for structural design γL is shown in Table 8.3. The combination value coefficient ψci should be determined for variable loads according to the following principle: Given partial coefficients γG and γQ for variable load and γR for resistance, then for a combination of two or more variable loads, the determined combination value coefficient should ensure optimal consistency between the reliability index β of the structure or structural component designed according to the partial coefficient expression and the target reliability index. The combination value coefficient of variable load can be determined by the following steps: Table 8.3 Load adjustment coefficient of service life for structural design γL. Note: For a structural component with a designed service life of 25 years, γL should be set according to the codes for the design of various structures. If any of the following events occurs to a structure or structural component, it shall be confirmed that the structure or structural component has exceeded its serviceability limit state: (1) deformation that affects serviceability or appearance; (2) local damage that affects serviceability; (3) vibration that affects serviceability; and (4) other specific states that affect serviceability. For the serviceability limit state, it should be designed by the following formula using the standard combination, frequency combination or quasi-permanent combination of loads depending on different design requirements: where C is the specified serviceability limit for structures or structural components, such as the limits of deformation, cracks, amplitude, acceleration, stress, etc. When there is a linear relationship between load and load effect, the effect design value of the standard combination can be calculated as follows: The notation in Equation (8.1) is the same as the bearing capacity limit state design expression. However, for the serviceability limit state [8-24], the partial coefficient γM of material properties should be set to 1.0 unless otherwise specified in the design codes. The reliability index of serviceability limit state design for structural components should be set to 0∼1.5 according to the degree of reversibility. Environmental impact should be assessed during the design of building structures. When the environment has a significant impact on structural durability, the proper structural materials, design structures, protective measures and construction quality requirements should be adopted, depending on different environmental factors. Also, a regular structural overhaul and maintenance system should be established so that structural safety and serviceability is not affected by material degradation within the designed service life. Environmental impact on structural durability can be evaluated by engineering experience, experimental investigation, calculation, inspection or comprehensive analysis. If any of the following events occurs to a structure or structural component, it shall be confirmed that the structure or structural component has exceeded its durability limit state: (1) the material properties have deteriorated, affecting structural bearing capacity and serviceability; (2) the material is cracked, deformed, chipped or weakened, affecting structural durability; and (3) other specific states occur, affecting structural durability. In terms of the durability limit state, it should be designed by the following equation depending on specific design requirements and environmental conditions [8-25] where C represents the limits of a structure or its components and their connection, determined based on environmental erosion and other material characteristics. This may include the corrosion of steel structures, corrosion cracks on the surface of concrete components or the decay of wooden structures caused by mold. The effect of durability is different from that of the bearing capacity of components. This is a combination of environmental impact strength over a certain time span and the ability of components to resist environmental impact. The signs or limits of the durability limit state of structural components, as well as the damage mechanism, should be taken as the basis for adopting various durability measures. The structural durability limit state design should ensure that the signs or limits of the durability of structural components are not less than the designed service life. During the durability limit state design shown in Table 8.4, the reliability index of structural components should be set to 1.0∼2.0 according to the degree of reversibility. Table 8.4 Signs of durability limit state of various structures [8-16]. There are several corresponding regulations in the unified reliability standards and load codes for highway engineering, building structures and port engineering. These involve value methods for various partial coefficients and combined coefficients in structural design formulas. However, it is not difficult to calculate these by comparing the various regulations with each other: According to the Unified Standard for Reliability of Engineering Structures, GB 50153-92 [8-26], the frequency value of the variable load is taken as the load value of a 5% span-time rate, while the quasi-permanent value of the variable load is taken as the load value for not less than 50% span-time rate; in practice, this is often taken as the load value of 50% span-time. The Feasibility Study for the Zhoushan Continental Island Connection Project-Meteorological Observation and Wind Parameter Research Report [8-27] gives the monthly extreme wind speed data for Zhoushan, Shengsi and Beilun, and further provides wind speed design parameters for Jintang Bridge. Based on this data, this project provides an analysis of the wind speed cross-time rate distribution curve combined with a Monte-Carlo simulation, as shown in Figure 8.2. In Figure 8.2, the monthly extreme wind speeds in Zhoushan, Shengsi and Beilun are taken as the measured values. Based on the Meteorological Observation and Wind Parameter Research Report, the data for the Jintang Bridge is taken as the estimated value based on the above measured values. It is suggested in the report that the measured wind speed at Beilun should be used for estimation. In this study, the monthly extreme statistical distribution is obtained based on the estimated wind speed of the bridge position. On this basis, a Monte-Carlo simulation for 100 years is carried out to obtain the monthly extreme wind speed value of the bridge position for 100 years, after which the cross-time rate distribution data can be calculated. The statistical results are shown in Figure 8.2. In each of these cross-time rate statistical distribution maps, the abscissa is the wind speed ratio, that is, the ratio of the set wind speed to the maximum wind speed across the total time, and the ordinate is the cross-time rate, that is, the sum of the time exceeding the set wind speed and the total time. Based on the results given in Figure 8.2, within 100 years, the wind speed of a 5% span time rate is 32.597 m/s, the wind speed of a 50% span time rate is 26.223 m/s, and the design wind speed of a 100-year return period recommended in the Meteorological Observation and Wind Parameter Research Report is 40.16 m/s. This means that the ratio of wind pressure value V0.05 of a 5% span time rate and V0.5 of a 50% span time rate to the standard wind pressure value VK should be as follows: Figure 8.2 Wind speed span-time rate distribution curve of a bridge. Target reliability refers to the reliability of a structure designed using the design checking calculation formula. Since the structural reliability standards of various countries are based on JCSS reliability model specifications, the target reliability of this calibration is also determined using these standards [8-28], as shown in Table 8.5 and Table 8.6. Because the sea-crossing bridge is an important project, the reliability index of crack resistance for the bridge components can be selected accordingly. In this calibration, three target reliability indexes are selected as the calibration points: βT = 1.5, βT = 2.0 and βT = 2.3. Table 8.5 Annual target reliability and failure probability of bearing capacity limit state. Table 8.6 Annual target reliability and failure probability of the serviceability limit state. Table 8.7 Calibration operating condition. See Table 8.7 for the operating conditions to be calibrated, and Table 8.8 for the statistical characteristics of parameters under each operating condition. All load effects in this calibration are considered as tensile stress of steel bars, and the four groups of load-effect ratios are determined as follows: In the formula, σGK is the standard value of steel bar stress caused by a dead load, σWK is the standard value of steel bar stress caused by wind (or wind + wave current), σWL is the long-term effect value of steel bar stress caused by wind (or wind + wave current), σVGK is the standard value of steel bar stress caused by vehicle, σVSK is the standard value of steel bar stress caused by the automobile braking force and σTK is the standard value of steel bar stress caused by temperature. Based on the reinforcement stress calculations for pier and pile foundation from the Zhoushan Island Connection Project, the calculation of various load-effect ratios is shown in Table 8.9 below. Table 8.8 Function distribution and parameters *. Remarks: The form of distribution and the coefficient of variation for dead load, temperature, vehicle and vehicle braking force are taken from the load specifications, while the coefficient of variation for wind load is estimated based on the wind speed distribution characteristics given in the Meteorological Observation and Wind Parameter Research Report. See the subsequent explanation for the actual estimation process. The deviation coefficient is determined using the ratio of the average action value for yearly distribution to the standard action value in the design reference period. Table 8.9 Load ratio. Reliability calibration is carried out as shown in Figure 8.3. The analysis and calculation for load-effect ratio shows that the load-effect ratio features the following characteristics: (1) the load-effect ratio of (wind or wind + wave current) and dead load varies significantly (0.07 ∼ 30), and in a small range of load-effect ratio, the steel bar is actually in a compressed state, making it unnecessary to check its crack resistance; (2) dead load in steel bar produces tensile stress in some cases and compressive stress in others, leading to different symbols of dead load action in the limit state equation. Therefore, the calibration method of hierarchy and situation is used, which involves the following states: Figure 8.3 Calibration process. For the combinations of “dead load + limit wind load” and “dead load + limit wind load + limit wave current”, the reliability calculation can be carried out using the following formula: Among these σ WK is the standard value of wind load effect; this is the standard value of wave and current load effect σ FK. Sum are the partial coefficients which are initially determined and can be considered as the approximate values of load frequency and quasi-permanent values r1, r2, respectively. Reliability calibration is performed by selecting a target reliability of 1.5, 2.0 and 2.3, respectively. For the combinations of “dead load + maximum wind load” and “dead load + maximum wind load + ultimate wave current”, the full stress expressions are still given based on Equations (8.7) and (8.8) during optimization analysis. The main calibration results provide the law of reliability index changing with load-effect ratio and the corresponding checking points. It can be found that: (1) when r1 = 0.54 ∼ 0.56 and r2 = 0.31 ∼ 0.4, the minimum reliability index is around 1.5; (2) when r1 = 0.65 and r2 = 0.35 ∼ 0.4, the minimum reliability index is near 2.0; (3) when r1 = 0.7∼0.72 and r2 = 0.38 ∼ 0.4, the minimum reliability index is around 2.3. Because of these factors r1 and r2, the range of values is very small, so we can basically think of them as values ψS and ψL. On the basis of the optimization analysis described in Chapter 8, a group of coefficients with the smallest deviation from the target reliability and the smallest deviation from the partial coefficients calculated according to the checking points are selected as the final calibration results. For the two operating conditions of “dead load + limit wind load” and “dead load + limit wind load + limit wave current”, the recommended values for reliability calibration are shown in Table 8.10. Short-term effect combination and long-term effect of internal force combination are calculated according to the following formula: Table 8.10 Recommended cost for reliability calibration. Where GK is the standard value of the internal force (or steel bar stress) under a dead load. This WK is the standard value of internal force (or steel bar stress) under a wind load for the 100-year design reference period. FK is the standard value of internal force (or reinforcement stress) under wave and current load during the 100-year design reference period. Since the construction of buildings entails the interaction of humans and machines, human factors should be considered an integral part of the entire system. The working environment (size of structure, lighting, ventilation, temperature, humidity and noise of working area, tools provided, management level, etc.), human behavioral characteristics (professional knowledge, working skills and experience, personal conditions, working attitude and motivation, emotional changes, etc.) and task complexity all exert a direct influence on human reliability. As indicated by the investigation results into a number of different construction accidents [8-29], these accidents are in fact mostly caused by human error. Therefore, the reliability of reinforced concrete structures taking human influence during construction into account can be analyzed by establishing simulation models for the occurrence of human error and its influence during the construction of concrete structures and formwork support systems [8-30]. The influence of human error in the construction process refers to all behaviors and results that are not in line with the requirements of relevant codes, laws, and regulations. If there was no influence of human error, the main reasons for deviation Ωa between actual size and design requirements of structural components would lie in measurement, machining error and formwork deformation after concrete pouring. Component size discounting human obeys a normal distribution, and its deviation falls within the range required by the relevant construction codes. In this paper, statistical parameters from relevant domestic surveys were taken as the distribution parameters of component size without the influence of human error (see Table 8.11 [8-31], Table 8.12), while a truncation was made corresponding to allowable deviation from relevant codes. See Figure 8.4 [8-32] for details of the construction deviations from the stipulated parameters. Table 8.11 Statistical data for geometric parameter uncertainty KA. Note: The statistical data for the KA of reinforced concrete components in this table were sourced from the literature [8-31]. Figure 8.4 Human error event tree. Table 8.12 Geometric size distribution of components without the influence of human factors. Table 8.13 Standard deviation of concrete strength. The strength of concrete, when discounting any influence of human error, obeys a normal distribution. By taking the construction preparation strength of concrete as the average strength, while neglecting human error, the concrete preparation strength fcu,0 can be expressed as [8-33] Where, fcu, k is the standard value of the designed concrete strength, and σ is its standard deviation. The standard deviation shall be based on recent data taken from the construction enterprise. See Table 8.13 [8-34] for the standard deviation of an actual average level of Chinese construction organizations as reflected by relevant statistical data. For the erection of a formwork support system without the influence of human error, cross bridging and sweeping rods shall be set according to relevant building codes. The fastening torque of all parts shall be 40 N•m. Construction and operation complexity leads to a large number of human errors during the construction process. The following common human errors are discussed in this chapter: The errors above are caused by such factors as calculation errors by technicians, issues of information exchange between technicians and construction operators, and construction worker carelessness. (1) Human error rate The likelihood of human error on a specific task can be expressed by the human error rate (PE): Where, NE is the number of operational errors in this task, while N is the total number of times the task is performed. In consideration of different error rates among different operators, even when performing the same task, the error rate is not a constant even when the same operator performs a specific task. Therefore, the human error rate should be regarded as a random variable subject to a certain probability distribution. In light of the application of lognormal distributions to the description of human error rate in human reliability analysis [8-35], a lognormal distribution was also used in this paper to describe the distribution model of human error. The distribution parameters of this error rate reflect the randomness of an error occurring due to factors affecting task completion, including different abilities, personalities, working environments, and similar. The average human error rate Where, Pr(F90) and Pr(F10) correspond to distributions of 90% and 10% error rates respectively [8-36]. The standard deviation of the logarithmic distribution of human error rate σ can be expressed as: In the absence of other criteria, the error coefficient EF is estimated by referring to the criteria for estimating the error coefficient of nuclear power plant operation under normal conditions, as given by Stewart et al. [8-37] (as shown in Table 8.14). (2) Degree of influence of human error Once an error occurs, the relative value of parameter deviation from the design requirements caused by human error is expressed as the degree of influence of human error mE. mE can be expressed as Where, xE and xm are the parameter values neglecting and including human error, respectively. Due to the complexity and uncertainty of the human error mechanism, the degree of human error is also a random variable subject to a certain probability distribution. No typical model can be found in the descriptions of random variables describing human error. In this chapter, a lognormal distribution was therefore chosen to describe the distribution model of the degree of influence of human error. Its mean estimate λBE and max. estimate λUB are the median of the lognormal distribution and the distribution value corresponding to 90%, respectively [8-37]. Both λBE and λUB were obtained from survey data. In particular, λBE is the statistical average of the average degree of human error experienced by all respondents, while λUB is the statistical average value of the maximum degree of human error experienced by all respondents. The standard deviation of the lognormal distribution Table 8.14 Estimation criterion for error coefficient EF. Table 8.15 Human error rate and distribution parameters for degree of influence. (3) Human error rate in the construction of buildings and the distribution of the degree of influence of human error Errors in the construction process of buildings include errors occurring in the construction of concrete structural components and to the erection of formwork support systems. Suppose the statistical distributions of section height, thickness and effective height of concrete components in the current concrete structure code include the influence of human errors, then they can be applied to the analysis of human reliability without truncation [8-38]. The rate of occurrence and degree of influence of human error in steel bar placement, concrete pouring strength and formwork removal are all taken from the literature [8-33][8-37] [8-39] as shown in Table 8.15. Through field investigation of human errors occurring during the erection of formwork support systems, it was found that errors often include failure to set cross bridging and sweeping rods, as well as insufficient tightening torque on fasteners. In light of the difficulties in obtaining data for human error on construction sites, quantitative data for the occurrence of human error and its influence on the main parameters of a structure can be obtained by simulating human error in construction. This can provide a basis for an analysis of structural reliability that considers human error during the construction process. The Human Reliability Analysis (HRA) method [8-35] was used to simulate human error and to establish models for its occurrence and influence. The event tree method was used within the HRA method to describe logic, while Monte-Carlo numerical simulation technology was used to analyze the event tree. This is a method that is commonly used for analyzing the influence of human error on many complex systems, such as in the system reliability analysis of nuclear power plants and electronic systems. It has the advantage of being able to break down a complex system into a series of simple tasks. Stewart [8-37] [8-38] [8-40] and Xu Maobo [8-37] repeatedly applied the HRA method to analyze the effect of human error on the reliability of concrete structural components. An event tree was used to describe the whole construction process. First, the construction process was broken down into several tasks which occur in turn, after which each task and its results were represented as nodes and branches of the event tree. There are two possible outcomes for each task: Success (error) and failure (error occurs). The task in Figure 8.4 consists of two operations, 1 and 2. In this figure, Si(i=1,2) indicates the success of operation i, while Fi(i=1,2) indicates the failure of operation i. A single error may trigger multiple errors (i.e., the branch of the event tree). Therefore, the event tree has multiple branches, which means that there will most likely be several different paths and several different results. Finally, the event tree was analyzed using Monte-Carlo numerical simulation technology. In other words, if the test starts from the beginning and runs to the end of the event tree, then we go through all possible paths on the event tree after multiple tests to consider all combinations of human error, thus ultimately calculating the structural reliability during construction. Human errors in construction were simulated separately, and divided into human errors in the construction of reinforced concrete structures, and human errors in formwork support system construction. (1) Simulation of human error in the construction of reinforced concrete structures Human error can be simulated based on the human error rate and the distribution of its impact. See Figure 8.5 for the simulation of error codes E3 and E7 in Table 8.5. The simulation process for error codes E1(a), E2(b), and E2 is elaborated in the Literature [8-35] and shown in Figure 8.6, where x2 is the reinforcement area in the other direction. Therefore, Table 8.15 does not list the average error degree λBE of the maximum error degree λUB for error code E1 (a). xmin and xmax in Figure 8.5 and Figure 8.6 are the minimum and maximum values of the parameters affected by human error. It can be easily concluded that the minimum values of reinforcement area, concrete strength and formwork removal time are 0 after the occurrence of human error. Since the minimum spacing of the stressed reinforcement slab is 70 mm and the maximum diameter of the reinforcement used is 16 mm, then the maximum area of reinforcement of the concrete slab affected by human error is the area corresponding to a spacing of 70 mm and a diameter of 16 mm. Figure 8.5 Block diagram of human error simulation program for E3 and E7. Figure 8.6 Block diagram of human error simulation programs for E1(a), E1(b) and E2. (2) Simulation of human error in the construction of formwork support systems Table 8.16 Influence of different human errors on the buckling strength of formwork support systems. Table 8.17 Occurrence of human error. Table 8.18 Distribution of tightening torque on bolts in different parts. Common errors occurring in formwork support system during investigation and construction include in Table 8.16: See Table 8.17 for the human error rate for E8 and E9. The human error coefficient is determined according to Table 8.14. See Table 8.18 for the distribution of fastening bolt tightening torque corresponding to E10 and E11, assuming it obeys a logarithmic normal distribution. The field measurement statistics show that the maximum value of the bolt tightening torque is 90 N·m, while the minimum value is 0. Therefore, the distribution in Table 8.18 has been truncated, and then human error effect analysis was carried out against a calculated example. For a formwork support with a step distance of 1.7m and a vertical rod spacing of 0.75m, the influence of the fastening bolt tightening torque on horizontal and vertical support rods on the buckling strength of the formwork support system is calculated under four different conditions respectively: (1) no cross bridging; (2) no sweeping rod; (3) cross bridging and sweeping rod; and (4) no cross bridging or sweeping rod. See Table 8.19 for the results, the values in which show the degree of influence on buckling strength caused by different human errors. Table 8.19 Average value of skid resistance for fasteners under different bolt tightening torques. Note: m(40) is the average value of anti-sliding bearing capacity of rightangle fasteners when fastening bolt tightening torque is 40 N·m. For fastening bolt tightening torques other than 20, 30, 40, 50 and 60 N•m, the cubic interpolation method was used, leading to extrapolation and interpolation as reflected in the values shown in Table 8.19. See Figure 8.7 for the simulation of the influence of different fastening bolt tightening torques on buckling strength under the four kinds of erection. Figure 8.7 Human error simulation program block diagram for E8 and E9. In terms of the influence of human error E11 on the slide resistance capacity of fasteners for a formwork support system, suppose the human error E11 exerts an influence on the mean value of slide resistance capacity for fasteners instead of on its variability. By means of a fastener anti-sliding test, a probability model for fastener anti-sliding bearing capacity when fastening bolt tightening torque is 40N•m was studied, and the difference of fastener anti-sliding bearing capacity at 20, 30, 50, 60N•m and 40N•m was analyzed, as shown in Table 8.18. The third interpolation method was used to determine the fastener anti-slide bearing capacity corresponding to other tightening torques, with the Monte-Carlo numerical method used to simulate the influence of different bolt tightening torques on the fastener anti-slide bearing capacity. The Monte-Carlo method can combine the calculation of system reliability with the simulation of human error occurrence and its effect on structural parameters. This enables each calculation cycle to be regarded as a numerical computer simulation experiment. The method above was used to calculate structural system reliability under the influence of human error during the construction period, as shown in Figure 8.8. A 10-storey beamless floor structure with a storey height of 3m, column grid size 6,000mm×6,000mm, column size 550mm×550mm, and slab thickness of 200 mm; concrete strength of the concrete slab and column: C30; positive and negative moment reinforcement: HPB235 steel and HRB335 steel. Area of reinforcement at support: 1,214 mm2/m; area of reinforcement at mid-span: 808 mm2/m. Fastener-type steel pipe formwork is used for support. Steel pipe φ48 mm×3.5 mm; vertical rod spacing 750 mm; step distance 1,700 mm. Section stiffness of the bracing system is 6.4×10³ kN, determined after considering the influence of wood keel on bracing stiffness and the depreciation effect of steel uprights[8-41]. Both the construction period and concrete strength exert a significant influence on the safety of the concrete slab during construction period, but very little influence on formwork support system. EI-Shahhat et al. [8-42] and Eppaarachchi [8-43] studied their influence on the reliability of concrete slabs during the construction period in detail. Therefore, the Monte-Carlo numerical simulation method was used in this chapter to calculate the reliability of a structural system during construction under the following conditions: (1) three support models: 3-layer formwork support (3S), 2-layer formwork support (2S) and 2-layer formwork support + 1-layer secondary support (2S1R); (2) different statistical parameters for the live construction load were used to study the influence of the formwork erection model and construction load on the reliability of the structural system during construction. Figure 8.8 Flow chart for structural system reliability calculation in construction period under the influence of human errors. Since the research object is a structure with a storey height of only 3m, human errors such as absence of cross bridging and sweeping rods and incorrect fastening bolt tightening torque being used, as discussed in the previous section, were also considered, but errors in extension and verticality of vertical rods in the construction process of the formwork support system were not. To study the influence of human error, the system failure probability of the three support models (3-layer template support 3S, 2-layer template support 2S, and 2-layer template support 1-layer secondary support 2S 1R) were calculated, both for the case where human error was taken into account and for the case where it was neglected. See Table 8.20 for the results. It can be seen from Table 8.20 that human errors during construction exert a significant influence on the reliability of the formwork support system and concrete structure. See Figure 8.9 for the overall structural failure probabilities of the three support models with and without human errors. Nonetheless, due to the inspection and acceptance link in the actual construction process, the failure probability for the structure under the influence of human error in Table 8.20 and Figure 8.9 is larger than that of the actual project. After inspection, the human error deviating from the normal value will be detected and corrected, and the failure probability of the structure will be greatly reduced. Table 8.20 Comparison of failure probability. Note: FE means no human error while E means human error. Figure 8.9 Influence of human error. Under the influence of human errors, the formwork support system rarely becomes unstable or destroyed. Most problems are caused by anti-sliding failure of fasteners, while the destruction of concrete slabs is mainly due to bending problems. Because the bending failure of horizontal rods at the bottom of the formwork is mainly affected by the distance between the vertical rods, the human error in the construction process of the formwork support system considered in this paper does not affect the bending failure probability of horizontal rods at the bottom of the formwork. The bending failure probability of horizontal rods can be effectively reduced by shortening the distance between vertical rods. Although human errors E8, E9 and E11 exert a significant influence on the overall stability of the formwork support system, the formwork support in this example was designed according to the requirements for anti-sliding bearing capacity of fasteners, while the buckling strength of the formwork support system is much higher than the required value under the influence of human errors. Some instability damage also occurs under the influence of human errors. Human error E10 exerts a significant influence on the anti-sliding capacity of right-angle fasteners. Compared with E10 without human errors, the failure probability of the formwork support system increases dramatically upon occurrence of human error. The occurrence of human error in E10 must therefore be strictly controlled in order to ensure the safety of the formwork support system and the entire construction.
8
Application of Reliability Theory in Specifications
8.1 Requirements of Structural Design Codes
8.1.1 Requirements of Structural Design
8.1.2 Classification of Actions
8.1.3 Target Reliability
Failure type
Class of structure
Important
General
Minor
Ductile Structure
3.7
3.2
2.7
Brittle Structure
4.2
3.7
3.2
8.1.4 Limit State of Structural Design
8.2 Expression of Structural Reliability in Design Specifications
8.2.1 Design Expression of Partial Coefficients
8.2.2 Design Expression of Ultimate Limit State
Safety class
1
2
3
Designed Service Life
100
50
5
Factor for Importance
1.1
1.0
0.9
Designed service life (year) of the structure
γL
5
0.9
50
1.0
100
1.1
8.2.3 Design Expression of Serviceability Limit State
8.2.4 Design Expression of Durability Limit State
Structure type
Signs of durability limit state
Wooden Structures
Steel tubes wrapped on steel structures and concrete-filled steel tube structures, and section steel components in combined steel structures
Aluminum alloy, copper and copper alloy components and connections
Concrete reinforcement bars and metal connectors
Structural components of inorganic nonmetal materials such as masonry and concrete
Polymer materials and structural components
Light-transparent glass components
8.3 Example: Target Reliability and Calibration of Bridges
8.3.1 Basic Issues
8.3.2 Parameter Analysis
8.3.3 Calibration Target Reliability
1
2
3
4
Relative failure loss
Moderate failure with minor consequences
Moderate failure consequences
Significant consequences of failure
high
β = 3.1, Pf ≈ 10−3
β = 3.3, Pf ≈ 5×10⁻⁴
β = 3.7, Pf ≈ 10−4
medium
β = 3.7, Pf ≈ 10−4
β = 4.2, Pf ≈ 10−5
β = 4.4, Pf ≈ 5×10⁻⁶
low
β = 4.2, Pf ≈ 10−5
β = 4.4, Pf ≈ 5×10⁻⁶
β = 4.7, Pf ≈ 10−6
Relative failure loss
Target reliability index for unrecoverable limit states
high
β = 1.3, Pf ≈ 10−1
medium
β = 1.5, Pf ≈ 5×10⁻²
low
β = 2.3, Pf ≈ 10−3
Direction of action
Number of load case
Content of load case
Participation
Longitudinal
1
Permanent action + maximum wind load
Dead load, wind
2
Permanent action + automobile + automobile braking force + temperature force + wind load on vehicle
Dead load, temperature, vehicle
3
Permanent action + maximum wind load + ultimate wave and current force
Dead load, wind, wave current
4
Permanent action + maximum wind load + maximum wave and current force + temperature force
Dead load, wind, wave current, temperature
Horizontal *
5
Permanent action + maximum wind load
Dead load, wind
8.3.4 Operating Conditions and Parameters
8.3.5 Load Effect Ratio

Action
Distribution type
Coefficient of variation*
Deviation coefficient *
Dead load

0.05
0.924
Wind load
Annual extreme value distribution: F (x) = exp {− exp [−α (x − μ)]}
0.412
0.3266
Temperature
Annual extreme value distribution: F (x) = exp {−exp [−α (x − μ)]}
0.03 (maximum)
0.474 (lowest)
0.276 (tempera ture difference)
0.9614
Vehicle load

See specification GB/T50283-1999
Vehicle braking force
Annual extreme value distribution: F (x) = exp {−exp [−α (x − μ)]}
See specification GB/T50283-1999
Pier number
Dead load G
Wind load W
ρ1 = σWK / σGK
Nz
Hx
My
Hx
My
Compressive stress ratio
Tensile stress ratio
Load (action) effect of pier shaft and pier bottom along bridge direction
C24
20785
110
1379
306
1829
0.073
-8.22 ×10-02
C25
52784
1443
12530
202
786
0.011
-1.66 ×10-02
C26
54011
1463
14843
244
1130
0.015
-2.43 ×10-02
C27
54911
1467
17801
303
1700
0.021
-3.81 ×10-02
C28
55601
1458
21368
377
2593
0.031
-6.20 ×10-02
C32
60589
1458
40258
786
10498
0.096
-3.67 ×10-01
C33
62139
1467
45335
899
13489
0.116
-5.34 ×10-01
C34
63277
1463
50044
1015
16913
0.139
-7.74 ×10-01
C35
63882
1443
54112
1135
20772
0.164
-1.12
Load (action) effect of pier shaft and pier bottom in the transverse bridge direction
C24
20785
110
1379
2186
30670
5.51 ×10-01
-5.80 ×10-01
C25
52784
1443
12530
4973
67817
4.51 ×10-01
-5.42 ×10-01
C26
54011
1463
14843
5000
75125
4.82 ×10-01
-5.96 ×10-01
C27
54911
1467
17801
5036
85124
5.28 ×10-01
-6.78 ×10-01
C28
55601
1458
21368
5083
97882
5.88 ×10-01
-7.91 ×10-01
C29
54905
538
21449
5162
118148
7.17 ×10-01
-9.70 ×10-01
C30
57259
185
1257
5232
135418
8.99 ×10-01
-9.14 ×10-01
C31
57815
354
25314
5304
152948
8.68 ×10-01
-1.22
C32
60589
1458
40258
5358
165880
8.36 ×10-01
-1.41
C33
62139
1467
45335
5435
183901
8.86 ×10-01
-1.57
C34
63277
1463
50044
5510
202134
9.39 ×10-01
-1.76
C35
63882
1443
54112
5586
220579
9.99 ×10-01
-1.96
8.3.6 Reliability Calibration Process
8.3.7 Results of Reliability Calibration Calculation
βT
Pf
γG
ψS
ψL
1.5
7 × 10⁻²
1.0
0.55
0.35
2.0
3 × 10⁻²
1.0
0.65
0.35
2.3
1 × 10⁻³
1.0
0.70
0.40
8.4 Reliability Analysis of Human Influence
8.4.1 Parameters of Human Influence
Structural type component
Item


Reinforced concrete components
Height and width of section
1.00
0.02
Effective height of section
1.00
0.03
Cross-sectional area of longitudinal reinforcement
1.00
0.03
Concrete cover thickness
0.85
0.30
Average stirrup spacing
0.99
0.07
Anchorage length of longitudinal reinforcement
1.02
0.09
Formwork support steel pipe
Outer diameter
1.00
0.01
Wall thickness
0.94
0.09
Formwork support erection
Step distance
0.94
0.05
Spacing of vertical rod
1.05
0.21
Item


Max. allowable deviation
Height and width of section
1.0
0.02
-5mm, +8mm
Concrete cover thickness
0.85
0.3
-5mm, +8mm
Concrete strength grade
C10∼C20
C25∼C40
C45∼60
σ (N/mm3)
4.0
5.0
6.0
8.4.2 Influence of Human Error on Construction
8.4.3 Human Error Rate, and Degree and Distribution of Human Error Influence
 can be obtained from survey data or the relevant literature, and this estimate is also used as the median of the logarithmic human error rate distribution model. Since it is difficult to calculate the parameter σ (which represents the dispersion of human error rate distribution) through investigation, the error coefficient EF is defined to determine the parameter σ. EF can be expressed as:
 can be expressed as:
Mean error rate estimate 
Error coefficient
<0.001
10
0.001-0.01
3
>0.01
5
Error code
Error type
Average error rate 
Error coefficient EF
Average error degree λBE (%)
Max. error degree λUB (%)
E1(a)
Reduction of reinforcement area due to incorrect direction of steel bar
0.0077
3
—
—
E1(b)
Reduction of reinforcement area due to other factors
0.0154
5
-14.6
-52.9
E2
Increase of reinforcement area
0.012
5
11.3
39.8
E3
Reduction of concrete strength
0.22
5
-12.3
-43.5
E4
Thickness error of concrete slab
Normal distribution: Average = standard, coefficient of variation =0.02
—
—
E5
Column size error
Normal distribution: Average = standard, coefficient of variation =0.02
—
—
E6
Thickness error in concrete cover
Normal distribution: Average =0.85 times standard and coefficient of variation =0.3
—
—
E7(a)
Premature formwork removal (5-day construction cycle)
0.0175
5
-20.0
-44.0
E7(b)
Premature formwork removal (7-day construction cycle)
0.0374
5
-21.4
-40.0
E7(c)
Premature formwork removal (10-day construction cycle)
0.0396
5
-22.0
-43.3
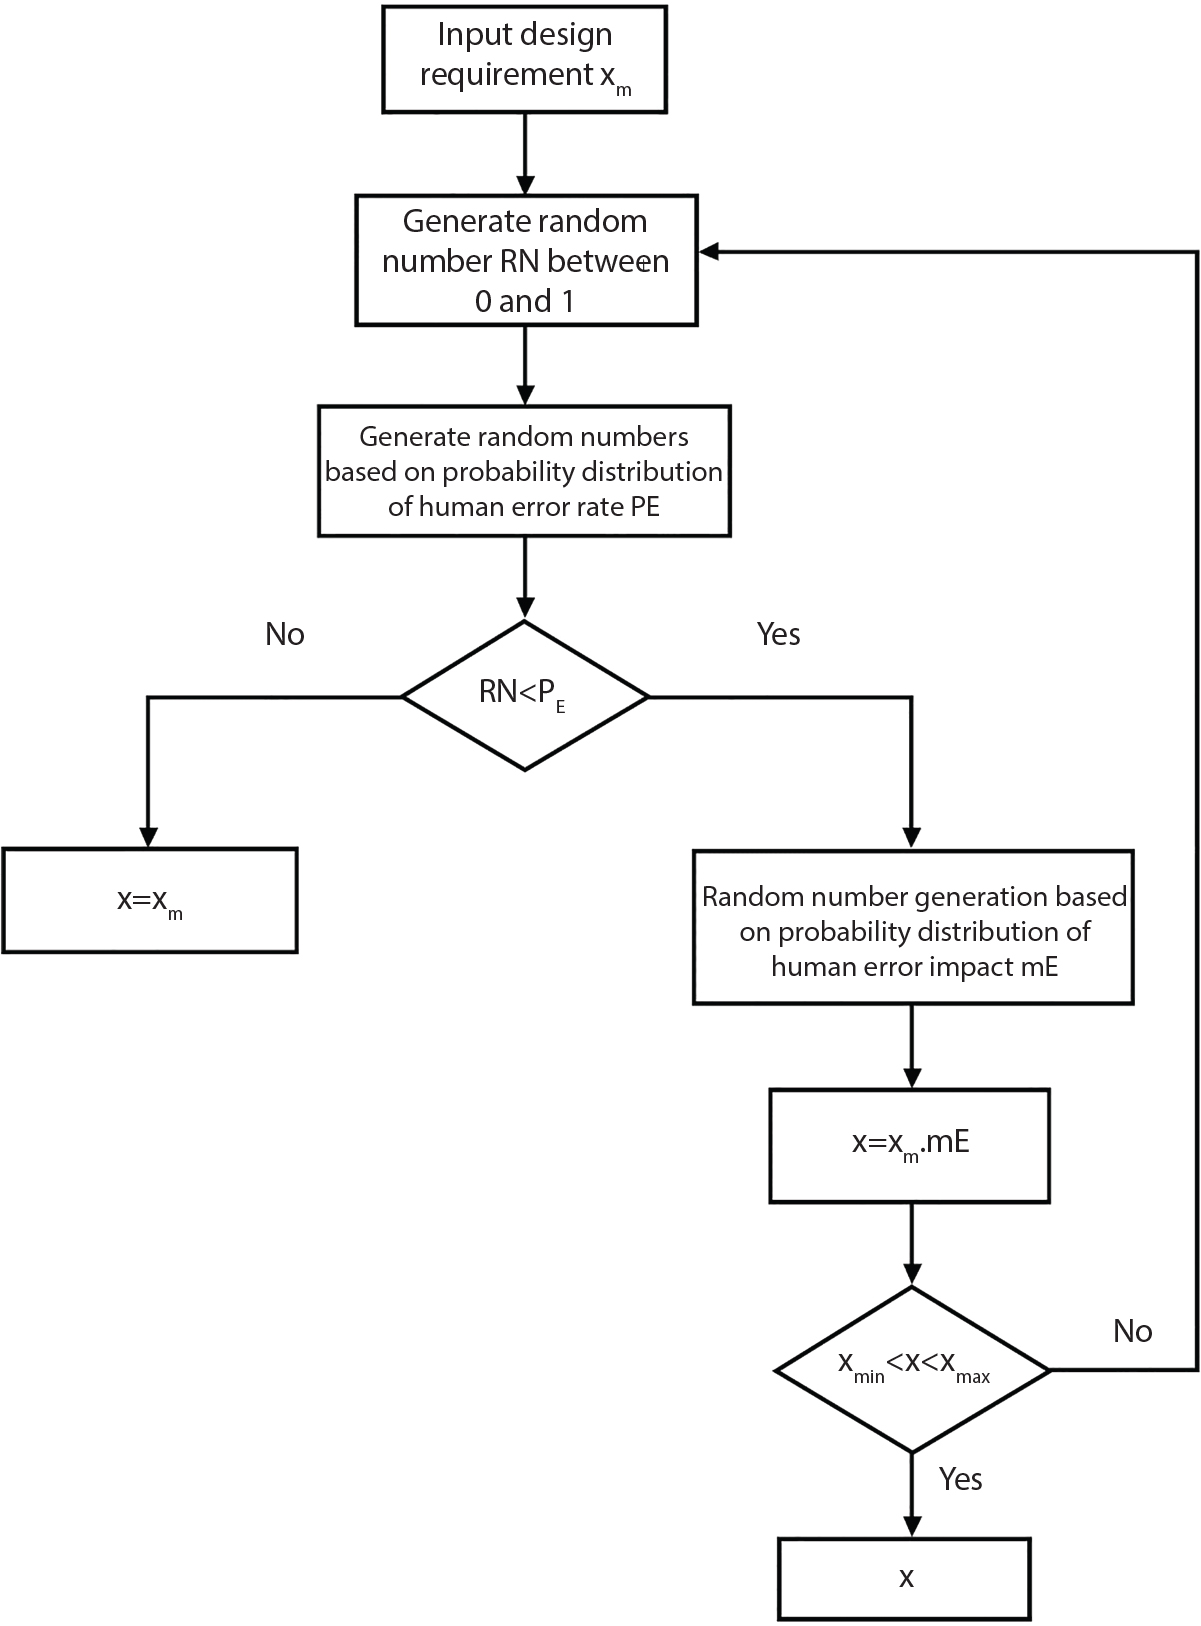
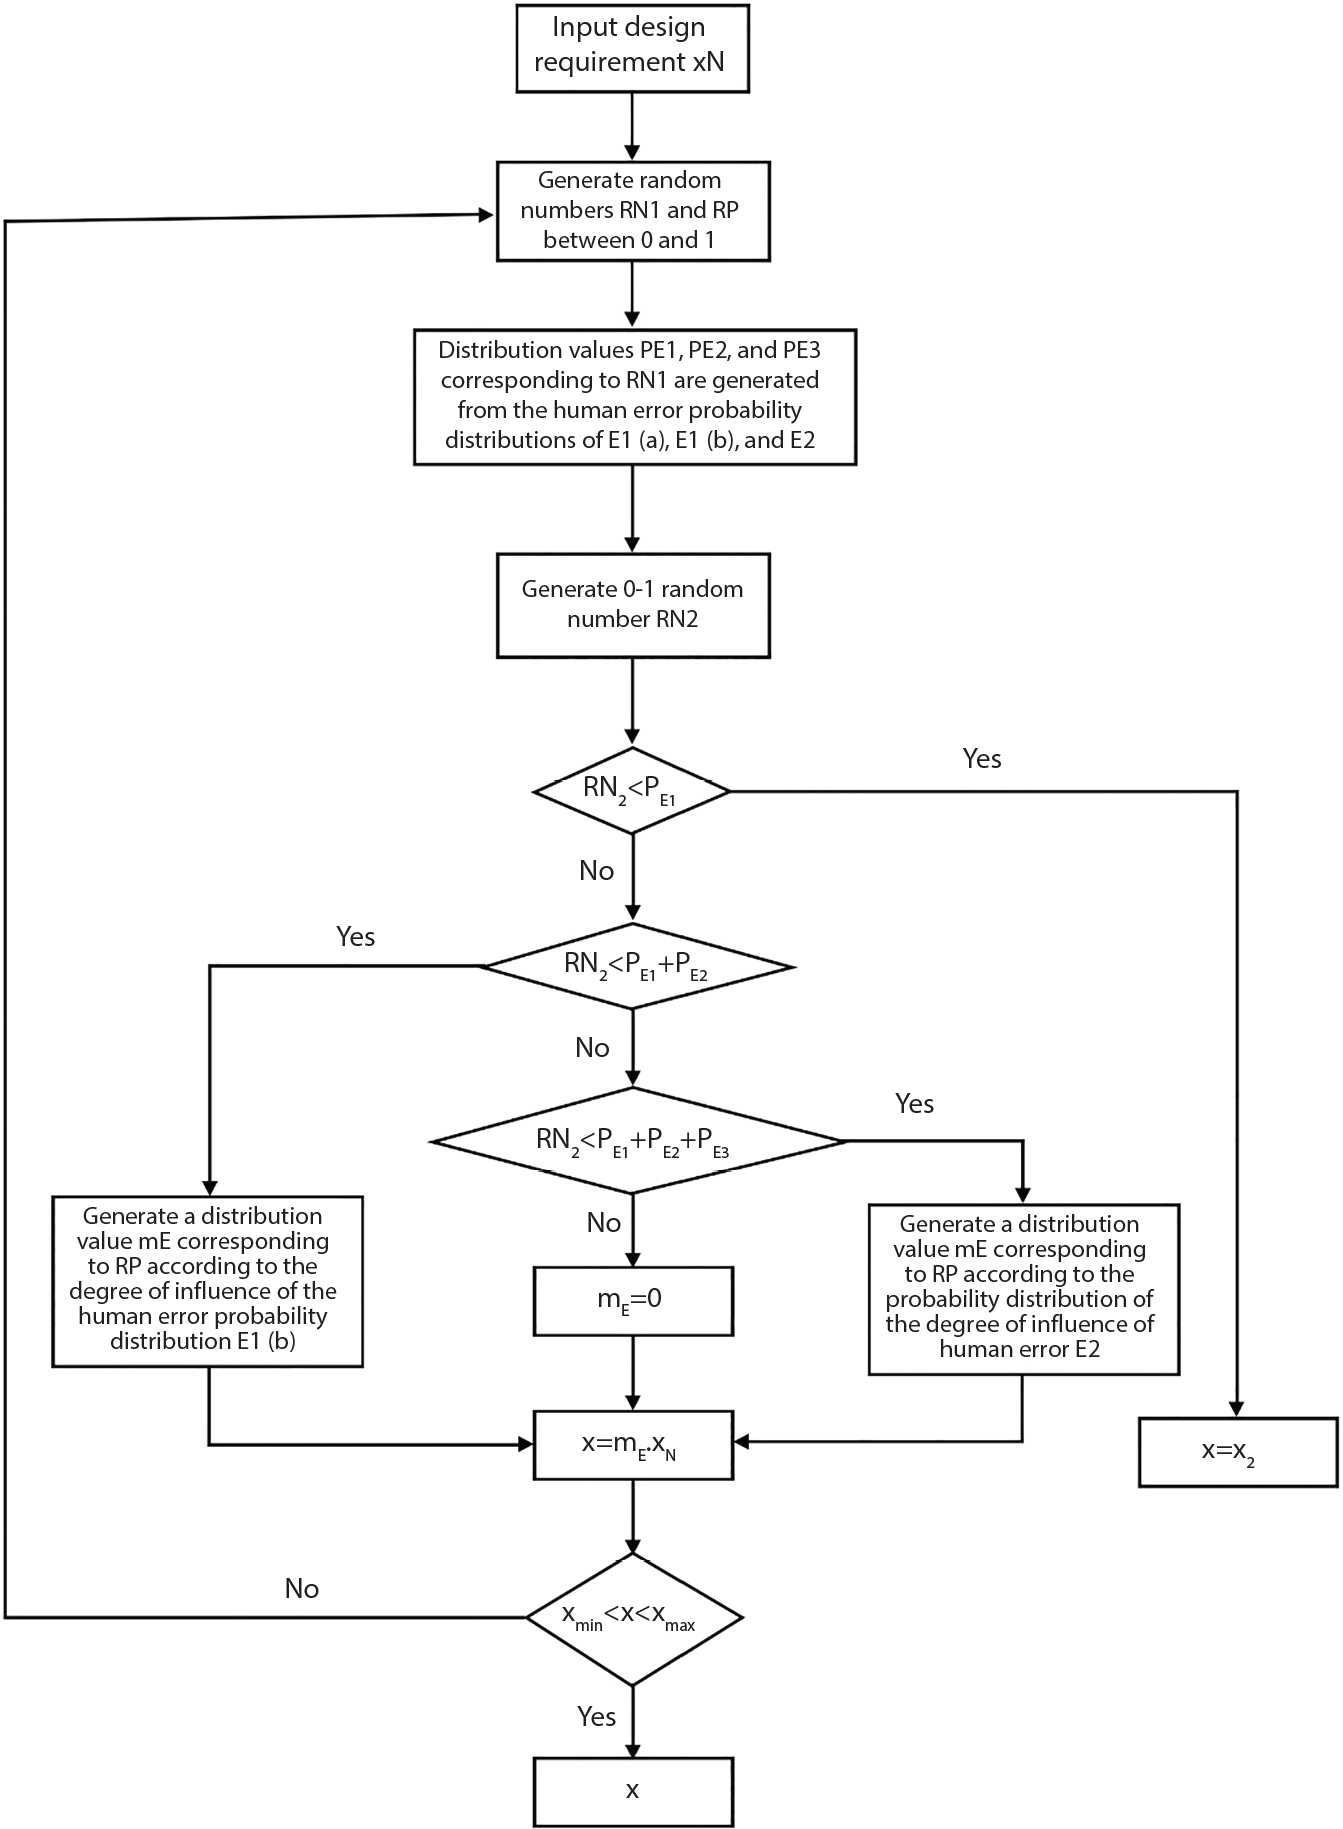
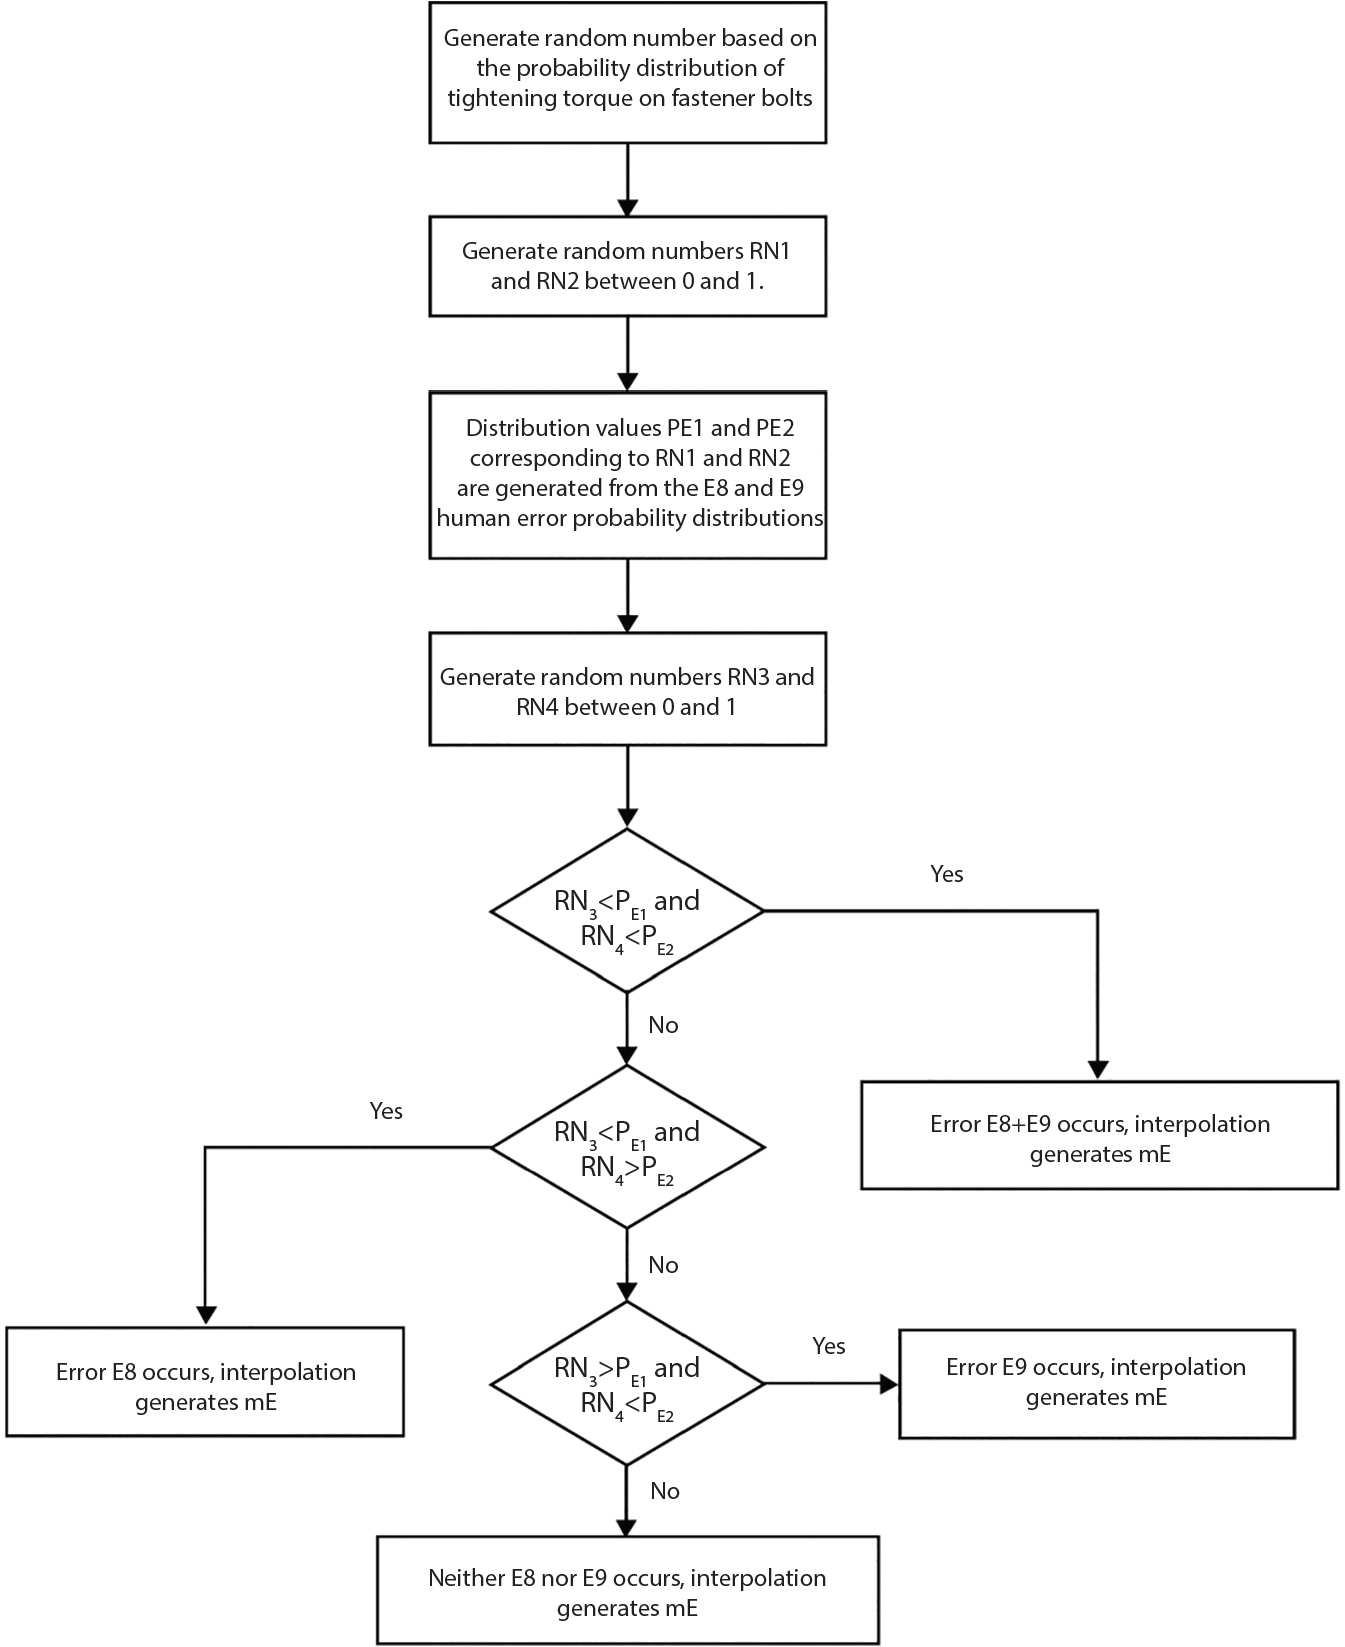
8.4.4 Simulation of Human Error in Construction
Design
Tightening torque on fastener bolts (N•m)
20
30
40
50
60
No E8 and E9 occur
-0.111
-0.052
0
0.009
0.035
E8
-0.561
-0.488
-0.428
-0.418
-0.384
E9
-0.263
-0.242
-0.231
-0.227
-0.223
E8+E9
-0.693
-0.65
-0.619
-0.612
-0.597
Item
Error rate
Setup of sweep bar
0.45
Setup of cross bridging
0.335
Verticality of vertical rod
0.22
Extension mode of vertical rod
0.2
Statistical parameters
Plate bottom fasteners
Vertical cross fasteners
Mean (N· m)
43.15
18.79
Standard deviation (N·m)
15.84
16.65
Distribution
Normal distribution N (43.15,15.842)
Exponential distribution EXP (18.79)
Fastening tightening torque/N•m
Average m/kN
Ratio m/m(40)
20
7.94
0.56
30
11.33
0.80
40
14.13
1.00
50
15.29
1.08
60
16.77
1.19
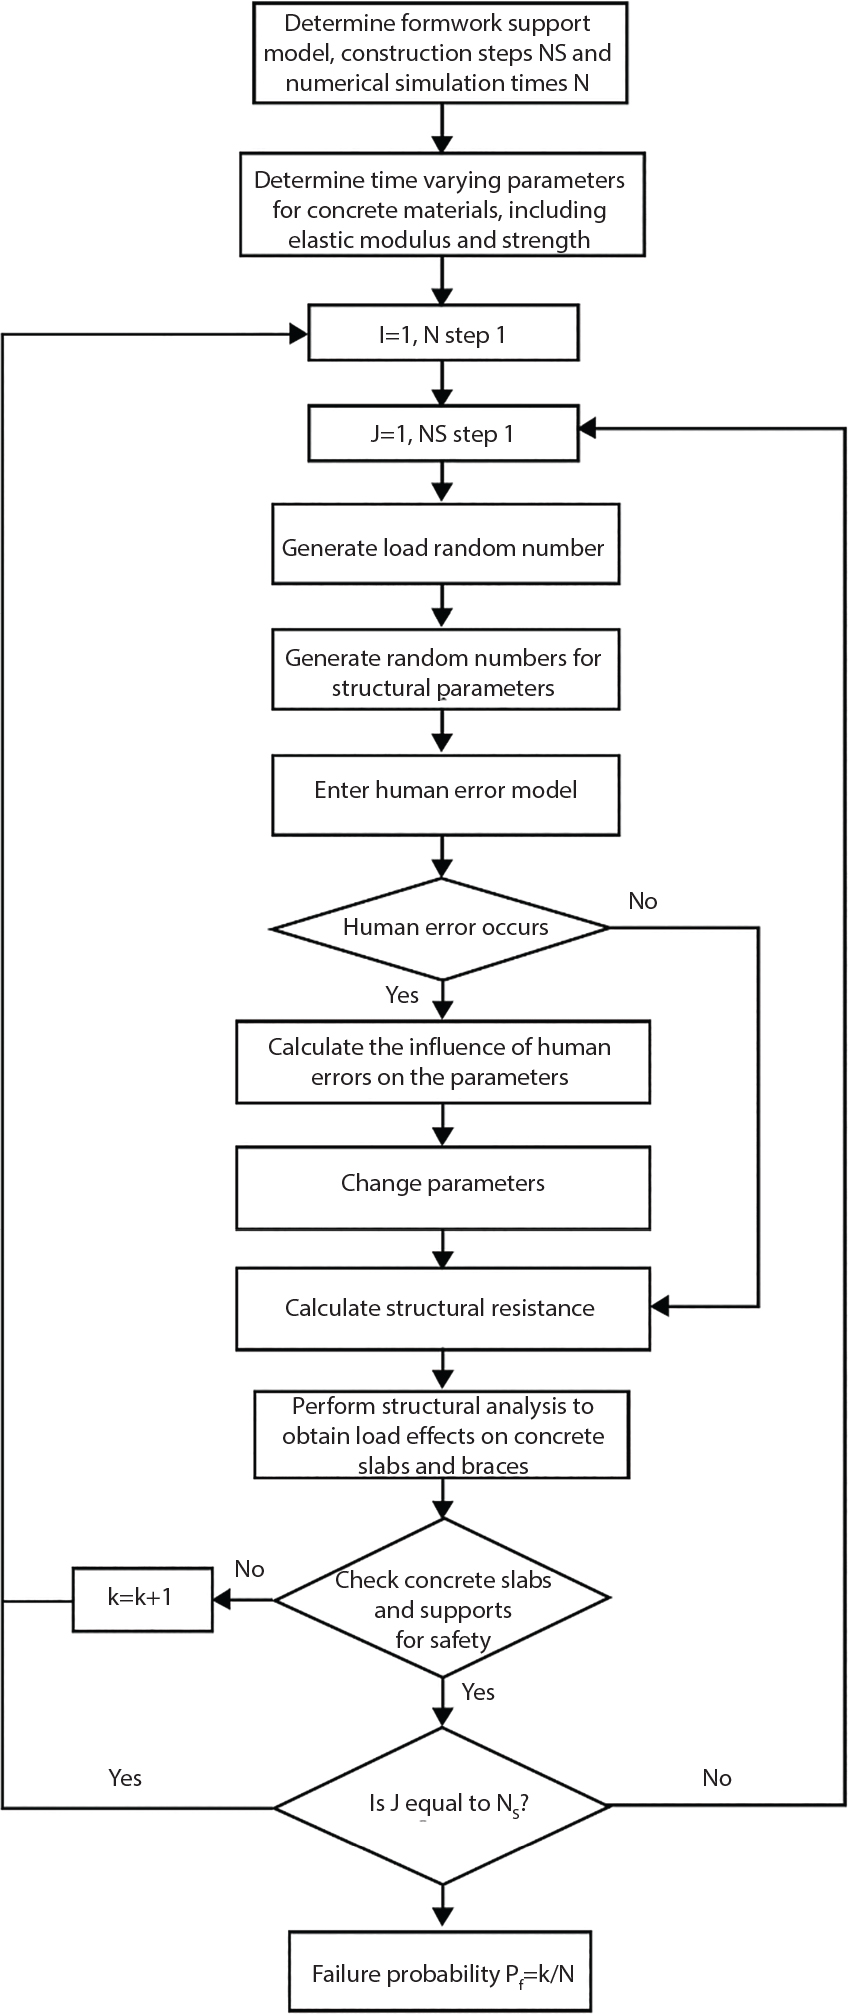
8.4.5 Example: Support System for a Ten-Storey Beamless Floor Structure
Item
Pf × 10−2
2S
2S1R
3S
FE
E
FE
E
FE
E
Formwork support
0.66
5.23
0.66
5.16
0.87
5.80
Concrete slab
1.23
3.42
0.69
2.90
0.52
2.53
Overall structure
1.89
8.63
1.35
8.05
1.38
8.31
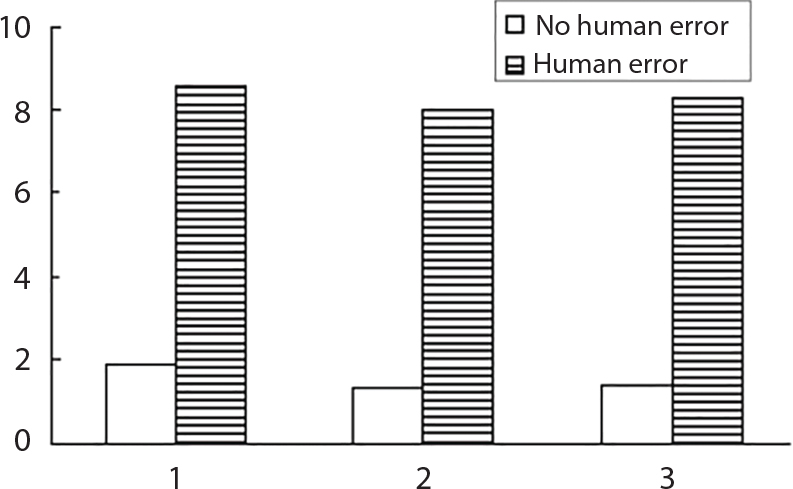
8.4.6 Discussion
References


