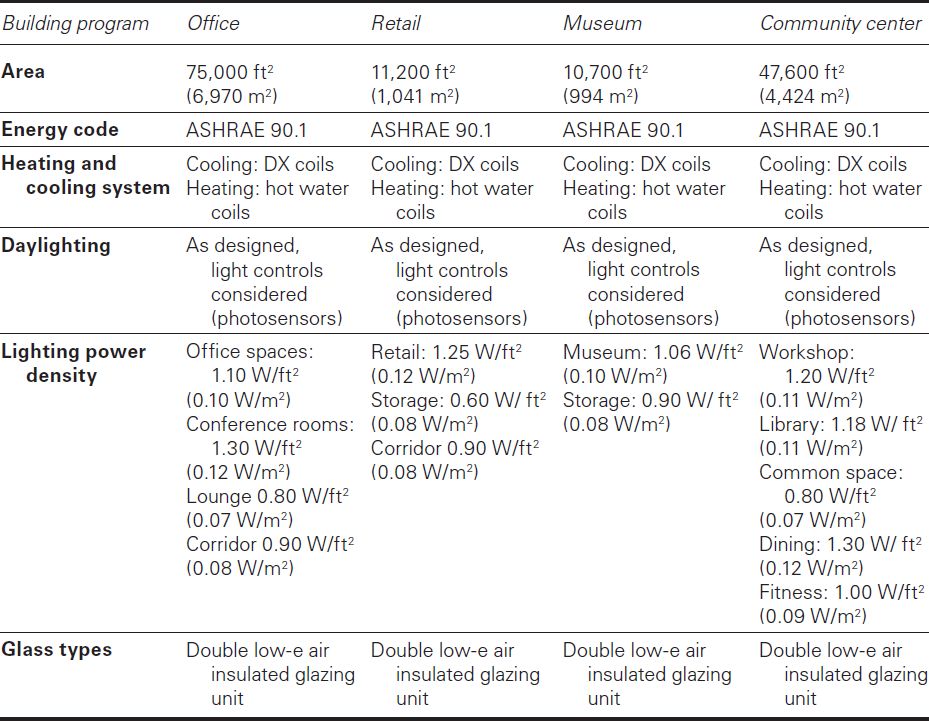
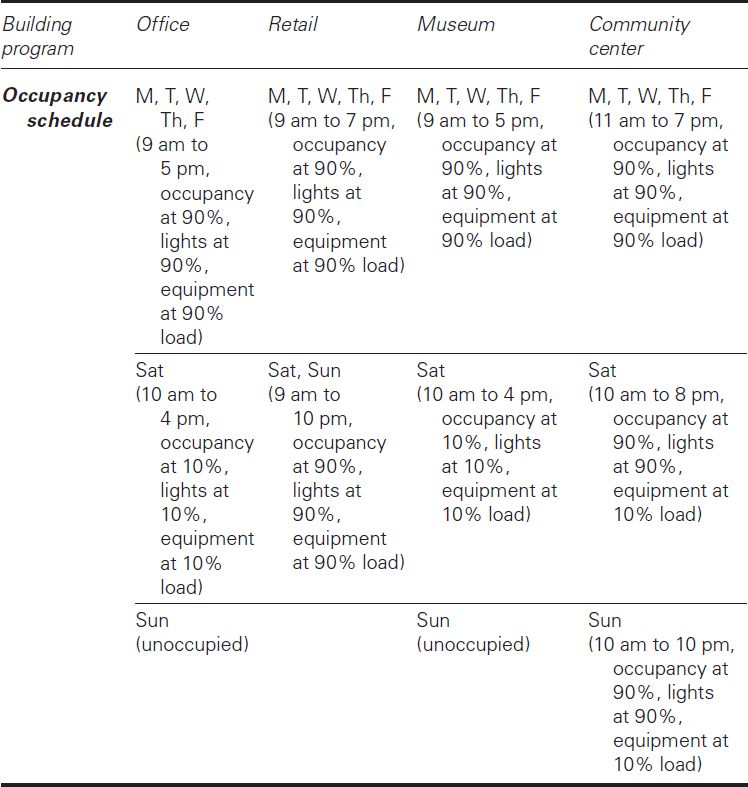
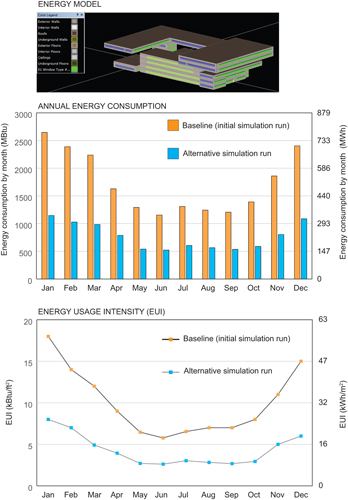
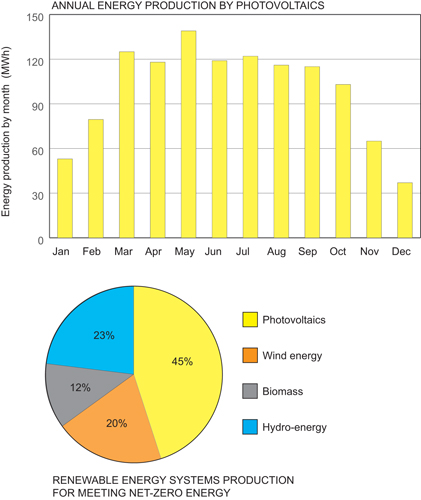
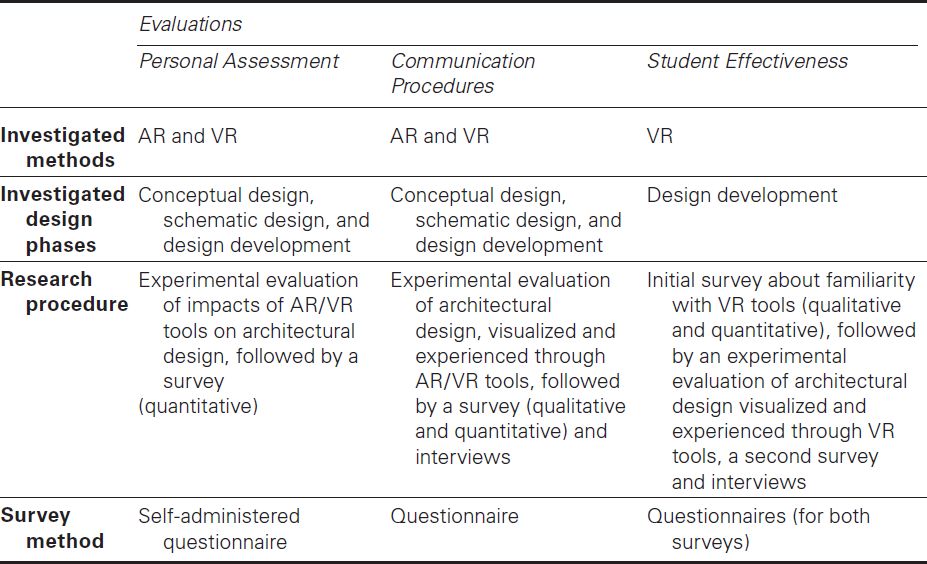
Historically significant buildings can be defined as buildings with distinctive physical and spatial qualities that manifest architectural and historic value, improve our understanding of the past, and typically demonstrate exemplary design techniques associated with a certain architectural style or historic period. To be classified as a historically significant building, a structure needs to be of sufficient age, a relatively high degree of physical integrity, and demonstrate historical significance. In terms of sufficient age, structures that are more than 50 years old are generally considered historic. Physical integrity refers to the state of the building—to be classified as historically significant, a building must be relatively unchanged, maintaining its characteristics and exemplary features. Historic preservation, in the context of architecture, is the process of preserving and protecting historically significant buildings. The primary goal of preserving historically significant buildings is to maintain the original character, architectural features, materials, and overall design intent. If historically significant buildings need to be renovated, the procedures are quite specific and different from other buildings—all the interventions need to be planned and executed in such a way as to maintain the original architectural design intent. This case study reviews research that was conducted for a historically significant building to determine and analyze original design features, assess the building’s current state and performance, evaluate how its current performance relates to the original design, and propose renovation strategies that would improve the building’s performance while maintaining the original design intent, particularly focusing on the building skin. The building, Spomen Dom (literal translation “Remembrance Home”), is an exemplary building of the Brutalist architectural style built between 1971 and 1975, located in Kolašin, Montenegro (formerly Yugoslavia) and shown in Figure 5.1. Designed by the Slovenian architect Marko Mušič, the building abstractly expresses vernacular forms present in this region, specifically traditional sloped residential roofs shaped in response to harsh winters, but in a different material—concrete. Figure 5.2 shows a sketch of Spomen Dom’s form and relation to the surrounding context. It was originally designed as a memorial and cultural center, but parts of it have been repurposed. The historical significance of this building lies in its expressive architecture, relationship to the context and history of this region, and exemplary design features that reflect the Brutalist architectural style. After the initial literature review relating to this building and the research goals, it was found that current studies that focus on analysis of its performance do not exist. Some literature sources were identified that captured design features, historical context, and significance of this building. However, existing studies that focus on its current state and performance do not exist. The research questions that were addressed include: In order to address these questions, qualitative and quantitative research methods were chosen, as shown in Figure 5.3. Particularly, archival research was used to address the first two questions, which included collection of the original architectural records, drawings, diagrams, documents, and photographs. The original documents had to be translated, since they were written in the Serbo-Croatian or Slovenian language. Observations were used to address the third research question, which included visits to the building, observations of the exterior and interior spaces, documentation, and photographing. The results of archival research and observations were used in the subsequent research process. Simulations and modeling were used to address the remainders of the research questions, where a BIM model of the building was developed to represent the original and current spatial organization and to analyze its performance in relation to passive design techniques (solar radiation and window-to-wall ratio). Combined heat and moisture transport analysis was conducted to analyze building skin performance. Lastly, the entire study is a case study because it focuses on detailed analysis of a single building. However, it demonstrates research procedures that can be applied to other types of research studies that focus on building performance analysis of historically significant buildings. The results of the archival research showed that the conceptualization of this unusual building with multiple civic and administrative programs was a result of the political movement and economic prosperity of its time. The reviewed archives included the original architect’s documentation, city hall archives, and local university’s archives. The primary purpose of Spomen Dom was to symbolically commemorate Yugoslavia’s victory over fascism during World War II, to inspire, celebrate, and strengthen its ideology, and to promote collective participation in cultural events. Spomen Dom was designed as a cultural center, memorial museum, and an administrative municipal building. The building is a prime example of Brutalism, an architectural style based on expressive geometric forms and concrete construction. In the context of Yugoslavian architecture, Brutalism was used from the 1950s to the 1980s as the dominant style to demonstrate the country’s progressive ideology (Stierli and Kulic, 2018). Civic buildings like Spomen Dom were especially designed as futuristic, progressive structures with extremely high budgets that reflected cultural identity in a modern way (Niebyl, 2018). The main goal was to democratize architecture and to make it widely available for people to enjoy, use, and inhabit. Buildings like this were meant to create innovative forms of public spaces, where education, cultural events, entertainment, and political activities were intertwined. However, with the collapse of Yugoslavia in 1991, these ambitious and stylistically explorative projects abruptly ended. Currently, many of the buildings are systematically neglected, abandoned, in ruin, demolished, or repurposed. Some of the buildings faced targeted destruction as the political context changed, and socialist ideology was no longer widely accepted. The observations that were conducted showed that Spomen Dom is currently in partial ruin, while a portion of the building is used as office spaces for the municipal services. Public gathering and cultural spaces have ceased to function. In the late 2000s, demolition and redevelopment of the project were planned, but these plans were abandoned. Little effort has been made to preserve the building’s existence, regardless of its historical significance and architectural qualities. The building was initially composed of three types of spaces, which were differentiated through size, volume, and materials. These included public halls, office spaces, and support spaces. The core compromised a “citizen’s vestibule”, which was surrounded by public halls. Two administrative wings—one longer on the west and one shorter on the east—extended from the public part of the building. The support spaces were placed on the lower level. Figure 5.4 illustrates the building program and spatial organization according to the design intent, while Figure 5.5 shows the current state and indicates parts of the building that are in ruin. Figure 5.6 shows photographs of the current state of the interior of the building. The results of archival research and observations were used to develop a detailed BIM model of Spomen Dom, using the Revit software program, shown in Figure 5.7. This model was used to evaluate building performance (passive design strategies), response to solar radiation, shading, window-to-wall ratio, and building skin performance. Spomen Dom’s north and south facades are elongated, while those of the east and west are minimized. The building’s shape responds to solar orientation, but there are very few differences in facade treatment for different orientations. Moreover, the relatively equal window-to-wall ratio between south and north facades is present. The solid mass prisms with triangular windows have a similar exterior treatment and size of glazing, regardless of the orientation. A BIM model was used to study shadows during different times of the year, as seen in Figure 5.8. Insight 360 Solar Analysis software was used as a simulation tool to evaluate solar radiation, as shown in Figure 5.9. Results indicate that the north elevation is exposed to direct daylight, and there is potential for solar heat gain in the early morning of the summer season—at all the other times, it is in complete shade. Since the building is located in a heating dominated climate where approximately eight months of the year require heating, the glazing along this elevation does not utilize passive solar heating. The results for the south elevation indicated that the administrative wings are facing direct sun at almost all times, and the only time that the offices are in shade is early morning in the summer. The solar radiation along this orientation is high. A double skin glazed facade is utilized along the south orientation, shown in Figure 5.10, which was quite an advanced building technology for the time when Spomen Dom was built. The main advantage of double skin facades is improved thermal performance. This double skin facade is vertically compartmentalized, spans from the ground level to the roof, and includes windows on the exterior side for ventilation, consisting of single glazing units. The adjoining offices have operable windows at the base and at the head of each level, which improve air circulation within the double skin cavity. Since air conditioning systems were not common at the time when the building was designed, the operable windows were intended to provide natural ventilation and cooling in the summer. There are some discrepancies between the original drawings and the constructed double skin facade. The operable windows were drawn as 180-degree rotational panels, but the actual installed windows only partially open at about 45 degrees. Also, horizontal blinds are shown in the air cavity as shading mechanisms, but these are not present in the current building (only vertical shades that are located further away on the interior side). Therefore, deviance from the construction documents may have negatively impacted the performance of this system. Installing a mechanical fan on the roof may help with air circulation and ventilation of the double skin cavity, as well as adding shading devices in the cavity. Solid wall assemblies were also analyzed. The typical concrete exterior wall was investigated, as seen in Figure 5.11. Material components and their properties were identified, and the overall thermal resistance of the assembly was calculated, which slightly exceeds the minimum recommended values for this climate. Simulations were performed to investigate combined heat and moisture transport using the WUFI software tool. The results have shown that significant moisture is retained on the building interior, likely due to the lack of an air cavity, insufficient insulation, two material layers that are trapping vapor within the assembly (epoxy coating on the exterior surface of the concrete and a vapor barrier between concrete and insulation), and the porous nature of the hollow masonry that is the support plasterboard interior finish. The solid wall and the triangular skylight for the typical prism component were also investigated, as seen in Figure 5.12. Thermal resistance of this assembly was calculated and exceeds minimum recommendations. This assembly includes a punched pyramidal opening with thick single layer glazing units—two per volume. Simulations were also performed for this assembly, and the results indicated that moisture is retained in this assembly as well. The final research results showed that the building skin of Spomen Dom is not well-performing and is adding to the deterioration of this architecturally important building. In order to preserve its state, careful renovations of the building skin would be required. These should include adding insulation on the building interior for the solid walls, incorporating continuous waterproofing, and adding air cavities. The skylights would also benefit from double insulated glazing units, to improve thermal performance. The double skin glazed facades would need to incorporate double insulated glazing units on the exterior skins, add shading elements within the cavity, and integrate small mechanical fans on the roof to help with the ventilation of the cavity. These changes would maintain the original design intent but would improve the building performance of Spomen Dom. Buildings like this deserve to be cherished and celebrated. Adaptive reuse of existing buildings is a growing area of architectural design, engineering, and construction. Adaptive reuse is the process of renovating an existing building, applying retrofit strategies, and transforming the building’s function to a new purpose. Adaptive reuse often focuses on buildings that do not have historic significance; therefore, the design and retrofit approaches are different from historic preservation projects. The architectural expression, choice of materials, and design interventions do not necessarily have to reflect the building’s original design intent. Adaptive reuse is an important aspect in sustainable and resilient design because it reduces our reliance on new construction, as well as the embodied energy and carbon emissions associated with new construction. Energy-efficient retrofitting of existing buildings can significantly lower our dependency on fossil fuels and improve building performance across the board. Through reusing and upgrading existing buildings, performance of the existing building stock can be improved, thus bringing more opportunities to reinvigorate and benefit local economies in the long run. Moreover, integrating Net-Zero Energy Building (NZEB) concepts into building retrofits can improve the energy efficiency levels in existing buildings and apply renewable energy sources to reduce their dependence on external energy infrastructure. Since the life of existing buildings is extended and possible demolition waste is avoided, net-zero energy retrofits also contribute to the development of sustainable and resilient urban environments. Typically, achieving net-zero energy goals can be realized through implementing passive design strategies, improving building enclosures, installing high performance HVAC systems to reduce heating and cooling loads, and reducing lighting and other electric loads, thus making it possible to offset the required energy balance with renewable means, such as photovoltaics or wind turbines. Figure 5.13 shows appropriate steps that should be implemented in achieving net-zero energy buildings, as well as the economic impacts, risks, and benefits associated with advanced building technologies. Passive design strategies should be implemented to reduce energy consumption as much as possible, since their costs are relatively low. Advanced building technologies, such as energy-efficient lighting and HVAC systems, as well as high-performance building envelopes, should then be employed, since their costs are higher, but they can significantly reduce a building’s energy consumption. Lastly, renewable energy sources must be used, but only after passive design strategies and advanced building technologies are exhausted since their costs are high. Figure 5.13 shows appropriate steps that should be implemented in achieving net-zero energy buildings, as well as economic impacts, risks, and benefits associated with advanced building technologies. Achieving net-zero energy goals is a challenging objective, especially when it comes to retrofit projects, because more constraints are typically imposed on existing buildings than new construction. This research study explored applicable passive and active design approaches that can be integrated to achieve energy savings by investigating feasible retrofitting techniques for building performance upgrading. The research focused on a specific case study, a commercial building located in Holyoke, Massachusetts (Aksamija, 2016; Aksamija and Wang, 2017). Also, the study investigated the ways to combine renewable energy generation installations to provide on-site renewable energy to meet net-zero energy goals. These following research questions were addressed: The research methods that were used to address these questions included qualitative and quantitative methods, as seen in Figure 5.14. Archival research was used to collect information about the existing building and its history, while observations were used to assess the current state of the building. Information about the original building was obtained and analyzed to develop redesign strategies that would facilitate the achievement of net-zero energy goals. Case study research was used throughout the research process since the study focused on a specific building. Simulations and modeling were used to assess the impacts of adaptive reuse design strategies on energy consumption and to quantify the performance of renewable energy systems. Energy modeling was used to drive design decisions, where the initial energy model that was built assessed the impact of retrofitting design strategies, such as change in building massing, impacts of daylight, improvement in building envelope, and retrofitting of lighting and HVAC systems. Then, an alternative energy model was developed which investigated the maximum energy savings that could be achieved by the combined design strategies. Different parameters within energy models were varied to perform a comparison of the base case and alternative design scenarios. Based on the calculation of annual energy balance and consideration of local climate and available resources, specific types of renewable energy generation installations were selected and integrated in the retrofit design program to ensure that sufficient energy could be generated on-site to offset the annual energy balance of the building to zero. Although the results of simulations and modeling are applicable only to the discussed case study building, the methods are applicable to any retrofit design project. The building that was chosen as a case study for this research is a 200,000 ft2 (18,587 m2) commercial building located in Holyoke, Massachusetts. The building was originally designed as a paper mill and built in 1895, but it has been renovated several times in its history. Currently, the majority of the building is abandoned, while a small part is used as a commercial office space. As part of the revitalization plan for this area, retrofits of commercial buildings would contribute to the development of a stable, healthy, and desirable neighborhood. Figure 5.14 shows the building’s context and the surrounding area, while Figure 5.15 presents the building site and the current conditions. The first step in adaptive redesign was to analyze the massing of the existing building, structure, and spatial organization and to determine how exactly the building form could be changed and improved. Building shape, orientation, and volume can significantly affect energy consumption (Aksamija, 2017). This is much easier to accommodate in new construction since the building form and massing can be determined from the early stages of the design process. In existing buildings, this is more complicated since the building form is already predetermined. For the case study building, building massing and form were modified to allow for daylighting and natural ventilation. Extensive BIM modeling was implemented to investigate changes to the building’s form and shape. It was determined that parts of the building should be demolished (mainly, parts of the second and third floor) and that two additional floors would be added to accommodate the new building program, as seen in Figure 5.17. The new program includes offices, classrooms, gallery space, retail space, and public space (community center). The program for the first level is shown in Figure 5.18. The middle part of the building was redesigned into a courtyard, which allowed the building to get back to its original appearance (the initial interior courtyard was closed off in the 1960s). With this retrieved courtyard, daylighting and natural ventilation were integrated as passive design techniques to reduce electricity consumption. Extraction of the existing building mass and addition of a new building mass created several roof gardens, which would offer public space for occupants and provide an area for placement of photovoltaic panels. Figure 5.19 depicts vertical transportation, circulation diagrams, shading system, and green roofs. Building envelope upgrade strategies included improving the exterior wall insulation to control the heat, air, and moisture transfer between the wall assemblies and the exterior environment. Newly added thermal insulation, an air barrier, and a vapor retarder would help the building acquire improved insulating and air sealing performance. For the top two floors, a new facade system was designed to provide an appropriate visual environment for the office areas and make full use of daylight to reduce energy consumption for lighting. A curtain wall system and an exterior horizontal sunshades system were combined to achieve environmental optimization and energy efficiency. The shading system would control the direct solar exposure and glare, making the interior daylighting environment ambient and comfortable. An energy-efficient HVAC system was integrated into the design, consisting of a radiant heating and cooling system and biomass heating. Since wood, agriculture residues, and crops are the most common fuels for biomass energy systems, easy accessibility to these organic matters in the western Massachusetts area would lead to reduced delivery and storage costs. Simulations of energy performance were conducted using the eQuest energy modeling software program. Two different models were simulated and analyzed to explore the energy savings potential of different design strategies—the initial baseline design and an alternative design. Renewable energy sources are necessary to achieve net-zero energy goals, and the energy modeling results also indicated how much energy would be required to meet those goals. Comprehensive thinking towards energy conversion ratio, feasibility, accessibility, and cost contributed to the decision of selecting four types of renewable energy systems that generated enough energy to support the operation of the building. Figure 5.20 shows sustainable design strategies that were considered in this adaptive reuse project, as well as renewable energy sources. Table 5.1 shows basic inputs for the energy models, and Table 5.2 shows occupancy schedules. TABLE 5.1: Inputs used for energy modeling. TABLE 5.2: Occupancy schedules used for energy modeling, according to building program. The baseline simulation results showed relatively high annual energy consumption, with an Energy Use Intensity (EUI) of 120 kBtu/ft2 (378 kWh/m2). Deep retrofit measures designed to address this problem incorporated control of internal loads and operating schedules, lighting, and improvement in the building envelope. For museums, classrooms, retail spaces, and offices, different demands for the interior lighting environment and occupancy schedules were taken into consideration in the energy modeling improvement process. Lighting power density (LPD), which is an important value associated with energy efficient lighting design, was reduced for all spaces in the building. In addition, planning and rescheduling work time for every functional room made it possible that significant lighting energy could be saved according to occupancy levels, and integrated occupancy sensors would ensure that lighting electricity is minimized. Other energy efficiency approaches included using materials that have high thermal mass and durability, as well as applying glazing with lower U-values. Since windows account for most of the energy loss, improving glazing is an effective way to reduce energy transfer through the windows. Double glazing with a low-e coating and argon gas fill was selected to substitute glazing for windows, thus significantly reducing heat transfer through the building envelope. After applying all the possible energy saving strategies, an alternative simulation run in eQuest was conducted to acquire a comparison analysis, lowering the EUI value to 52 kBtu/ft2 (163 kWh/m2). By comparing the baseline run and the alternative run, it was evident that energy performance improvement can be achieved. Figure 5.21 shows the energy model, as well as the results associated with the baseline model and the alternative run. In order to meet the net-zero energy goals, several renewable energy systems had to be implemented. High efficiency commercial photovoltaics (PVs) were considered to be placed on the roofs. Considering the limited site around the existing building, high efficiency PV panels can be used to provide a significant portion of the building’s energy demand. In addition, the working schedule for most spaces in the building are during daytime, so PV system can deliver power during the peak time when utility rates are relatively high. The design of PV arrays involved a series of 240 PV panels, covering 50,000 ft2 (4,646 m2) of roof area to provide 45% of the building’s energy demand. The monthly energy output for PV system is shown in Figure 5.22. In addition, installing wind turbines on top of the building to capture wind energy on site was considered. Medium vertical axis wind turbines with 2 KW generators were selected to be installed on the roof to generate 20% of the building’s energy demand. The reasons for choosing this type of wind turbines included their high efficiency, ability to catch wind from all directions, and simplicity of mechanical configuration. Since vertical axis wind turbines are without downwind coning, rudders, and yaw mechanisms, and their electrical generators are positioned close to the base, they are easy to install and maintain. Biomass and hydropower were also considered, based on the availability of resources and site-specific factors. Holyoke is located in western Massachusetts, which has significant agricultural resources, and it is cost-efficient to collect and deliver biomass materials. The biomass system was sized based on the heating demand and the capacity of the heating system and furnace. The last renewable energy source that was considered for the retrofit design of the building’s energy system was hydro-power. The location of this building was the primary reason for including hydro-power. Right beside an important canal of Holyoke, this building can integrate the hydro-power system with ease. Although site-based hydro-power is not widely used in commercial buildings due to specific site requirements and access to water, this particular building has great potential because of its proximity to the canal and existing hydro-power turbines in the City of Holyoke. Different from solar power, which only works during the daytime with enough solar radiation, hydro-power’s availability is very flexible, so it is possible to get a long-term, stable, and dependable payback with a one-time investment. For this building scale, a micro hydro system is suitable for placement, and a turbine can be applied to transform potential energy from the water flow into mechanical energy first, and this mechanical energy can be transformed into electric power later for building usage. The renewable energy systems that incorporate solar energy, wind energy, biomass, and hydro-energy made it possible to achieve net-zero energy goals, thus meeting the energy demand of the building with renewable energy sources on site. The breakdown of the supplied energy by renewable sources is shown in Figure 5.22. The facade is one of the most significant contributors to the energy budget and the comfort parameters of any building, and control of environmental factors must be considered during the design process. High-performance facades need to block adverse external environmental effects and maintain internal comfort conditions with minimum energy consumption (Aksamija, 2013). The purpose of this research was to analyze the thermal and energy performance of different facade types, as well as the impacts of climate change on facade performance. Improving thermal performance and minimizing thermal bridging are extremely important design strategies for high-performance facades. Thermal bridging within a wall occurs when a highly conductive material such as a metal support penetrates the facade’s insulation layer. This can significantly affect the thermal performance of the wall and decrease its effective thermal resistance. Thermal bridging can occur in all types of facades and significantly impacts thermal performance, energy consumption, and the thermal comfort of building occupants. Thermally improved facades limit thermal bridging and can improve thermal performance by using materials that reduce heat transfer between different components. The purpose of this research was to investigate heat transfer in several exterior wall types, methods for minimizing thermal bridging and improving thermal performance, and the effects of climate change on energy consumption (Aksamija and Peters, 2016a, 2016b). The following research questions were addressed: Quantitative research methods were used to answer these questions, as seen in Figure 5.23. Modeling and simulations were used to execute the research study, in which seven different facade systems were studied. Thermal modeling was performed to address the first three questions. The individual material layers of each facade system and their properties were modeled in detail, as well as the boundary conditions for exterior and interior temperatures. Four exterior temperatures were used as boundary conditions (variables) to represent different climate types, while interior temperature was constant. Heat transfer coefficients (U-values) were also calculated for each facade system. The energy performance of the seven facade types was studied using whole year energy simulations for a typical office space. The total yearly energy values included heating, cooling, lighting, and fans. Simulations were conducted for 15 cities in the U.S., representing different climate zones for three time periods: present day, the year 2050, and the year 2080. Weather files for 2050 and 2080 were created using a weather file generator that considers the impacts of climate change on weather patterns (Jentsch et al., 2013). Seven different facade systems were investigated, and their components are shown in Figures 5.24 to 5.30: Thermal modeling was conducted for each facade system in the THERM software program, where four different models were developed to represent different exterior environmental conditions, representative of different climate types and seasons. These included exterior temperatures of 90°F, 60°F, 30°F, and 0°F (32°C, 16°C, -1°C and -18°C), while the interior temperature was set at 72°F (22°C). This modeling was conducted to understand the behavior of these different exterior wall types under various conditions and to determine thermal gradients since this information is useful for the design decision-making process. Figures 5.31 to 5.34 illustrate the results for thermal gradients through all facade types. U-values were also calculated for all the analyzed facade systems using THERM software. Heat transfer through exterior walls depends on the following factors: 1) the difference in temperature between the exterior and interior environment, 2) the materials of the wall and their thicknesses, and 3) the thermal conductivity of material layers. The total rate of heat transfer through an opaque wall assembly is calculated by an area-weighted approach, where separate heat transfer contributions of different material layers are taken into account, based on the relative area that they occupy within the wall system. For glazed facades, the area-weighted approach is also used to calculate heat transfer, where the center-of-glass, edge-of-glass, and frame U-values are taken into account. Therefore, a total of 35 thermal models were developed and simulated. Figure 5.35 shows the results for U-value calculations and compares the thermal performance of the investigated facade types. The results show that Type 4 (conventional curtain wall) is the worst thermally performing facade system, while Types 6 and 7 are the best since their U-value is the lowest. These thermally improved systems would minimize thermal bridging in the building envelope, which would reduce energy consumption. The energy modeling was performed using the EnergyPlus simulation software program, simulating whole year total energy use for an office space enclosed by the seven different exterior wall types. The five opaque walls were modeled with window-to-wall ratios of both 20% and 40% for occupant views and daylighting, while the curtain walls were modeled with an 80% window-to-wall ratio. A single zone office space was chosen to highlight the thermal properties of the different wall types at different orientations. The dimensions of the office space were modeled at 13 ft (4 m) high by 12 ft (3.7 m) wide and 16 ft (4.9 m) deep. The facade was 13 ft (4 m) high by 12 ft (3.7 m) wide. The floor, ceiling, and three interior walls were modeled as adjacent to other interior spaces with the same thermal conditions without heat transfer occurring, but they would retain and release heat due to their thermal mass. The interior walls were modeled as gypsum board over steel studs, the floor was carpet over a concrete slab, and the ceiling was a drop ceiling of standard acoustical tiles. The Ideal Loads Air System component was used in EnergyPlus to study the performance of the office space without modeling a full HVAC system. Lighting was designed with a 0.5 W/ft2 (0.05 W/m2) load density and continuous daylighting control. The equipment load for the office was modeled at 0.7 W/ft2 (0.07 W/m2), and the occupancy load was one person. The single office space with each type of exterior wall was modeled and rotated in 12 different orientations at 30° increments, using climate data for three time periods (present day, the year 2050, and the year 2080), for 15 different cities, representing all climate zones in the United States, as shown in Table 5.3. Future predicted climate change weather files were created for the 15 climate zones for the years 2050 and 2080 using the climate change world weather file generator tool CCWorldWeather. These files were used to simulate and compare present day energy use with future energy use for each of the facade types. A total of 3,780 simulations were run. TABLE 5.3: Climate zones and representative cities used for energy modeling. The plotted results, shown in Figure 5.36, indicate general patterns for each of the different wall types in the 15 climate zones, considering current climate data. The results of the simulations show that the facades with a lower U-value have better energy performance for the whole year in all climates and orientations. In general, the opaque facades all performed better than the transparent curtain walls, despite the energy reducing possibility of heat gain in winter and daylight harvesting. The opaque walls also performed similarly for all orientations, with slightly better performance towards the north in warm climates and towards the south in cold climates. Orientation had a greater effect for the glazed walls, with the east and west orientations performing the worst. The south orientation performed the best in the coldest climates, but north facing walls performed the best for most of the other climate zones. In climate zones 1A through 3C, the north facing glazed facades performed nearly as well as the opaque facades. Simulation runs that considered impacts of climate change, which utilized weather files for the year 2050 and the year 2080, increased the total energy use for all climates and facade types. The north facing facades performed the best for most of the climate zones due to lower cooling loads. All facade types showed the highest total energy use in the year 2080. The next highest was the year 2050, and the lowest total energy use was for present day weather files. The results for a rainscreen facade with terracotta cladding and thermal isolators (Type 7) and a curtain wall with thermally broken aluminum framing (Type 5) were plotted and compared to represent typical results of all the wall types. Type 7 had the lowest conductance in this study for the opaque assembly, and Type 5 had the lowest conductance for a glazed facade. Figures 5.37 and 5.38 show impacts of climate change on energy performance, considering current climate data, year 2050 simulations, and year 2080 simulations for the best performing opaque and glazed exterior wall assemblies (Type 7 and Type 5). Figure 5.37 shows the total energy consumption, while 5.38 shows heating and cooling loads only. Type 7 with a 20% window-to-wall ratio had lower total energy use than Type 7 with a 40% window-to-wall ratio. Heating and cooling loads were compared for Type 7 with a 20% window-to-wall ratio, which shows that cooling loads dominate the energy use for the office space, except in climate zones 7 and 8. Cooling loads increase by a greater amount than the decrease in heating loads; therefore, net energy use is increased with climate change. Similar results are evident for the curtain wall. Augmented reality (AR) and virtual reality (VR) are computer-generated, simulated representations of real or imagined environments, where users can interact with simulated representations using various digital technologies. The similarities between AR and VR technologies are that they rely on digital representations of real or imagined scenes, objects, and environments and utilize advanced 3D modeling and visualization strategies. However, the major differences relate to the level of interaction— AR can only be “viewed”, while VR can be “experienced”. AR superimposes computer-generated visuals into a real-world environment and utilizes mobile devices, tablets, and computer displays to augment the physical environment with digital projections. On the other hand, VR offers a fully immersive digital environment and uses 3D computer-generated visuals to produce representations of the real world or imagined environments. AR and VR applications are a promising new direction for architectural design. A literature review was conducted to identify the current state-of-knowledge. Improved understanding of architectural design and communication procedures are the primary benefits of these novel technologies (de Freitas and Ruschel, 2013). These tools offer exploration of designed environments that is not possible with the traditional forms of representation, since they allow users to immerse themselves, visualize, and explore spaces during different design stages and before they are built. Besides advanced visualization, AR and VR tools enhance collaboration and communication among design teams (Fernando et al., 2013; Heydarian et al., 2015). However, studies focusing on the integration of these advanced digital technologies in the architectural curriculum are limited (Wang et al., 2013). Therefore, the primary research objectives of this study were to investigate implementation of AR/VR tools in architectural education and to determine whether these novel digital technologies are beneficial for the educational experience of students. Specific research questions that were addressed, shown in Figure 5.39, are: A combination of qualitative, quantitative, and experimental research methods was used to address these questions, as seen in Figure 5.39. The research methods included interviews, qualitative and quantitative surveys, case studies, modeling, and experiments. The experiments were conducted during the different stages of the design process and involved three different groups of users. The first experiment analyzed the effectiveness of AR/VR tools on the design process (personal assessment) during the conceptual design, schematic design, and design development. The second experiment investigated the effectiveness of these tools in collaboration and communication between the designer and the “client” during the conceptual design, schematic design, and design development (communication procedures), considering that in the context of architectural education, faculty members are acting as clients. The third experiment involved graduate architecture students, and evaluations were conducted in a group setting (student effectiveness), during the design development phase. These evaluations only included VR applications, since results of earlier studies indicated that AR tools are most suitable for the early stages of the design process. Table 5.4 summarizes the research procedures, survey methods, and design phases investigated in this study. TABLE 5.4: Summary of research procedures. Identical workflow for data exchange, design models, and AR/VR models were utilized for all evaluations. In terms of design elements that were included in the digital model during different design phases, the models increased in complexity and amount of information in later stages. The design development model included more detailed information than the schematic and conceptual design models, as seen in Table 5.5. The workflow involved preparation of AR/VR models (exported from design software programs and visualized through AR and VR applications), based on specific design phases and the level of detail. A BIM tool was used to create a design model (Autodesk Revit). Then, the model was exported as an FBX file type, which can be used for both AR and VR viewing/immersive purposes. SketchFab was utilized to view the models in AR. An Apple iPhone device was used to visualize this model, and the evaluations were performed in a typical office setting. Figure 5.40 shows AR models superimposed within physical space. To view and explore the models using VR, the Unity software program was used for a full immersive experience. Unity is a game development platform with the capabilities to build high-quality 3D virtual environments for immersive experiences. FBX files were exported for each evaluation, imported to Unity, and visualized with a VR headset and controllers. Figure 5.41 shows VR model visualized through a headset. In this research, a controlled setting was used for VR evaluations—a green room, equipped with a computer workstation (which included the Unity software program), headset, and controllers (HTC Vive headset and controllers). Figure 5.42 shows the experimental setting. TABLE 5.5: Summary of design elements and features included in the digital models according to different design phases. Design phase AR VR Conceptual design Basic building site and surrounding buildings Building massing and geometry Building volume Individual levels of the building Basic building site and surrounding buildings Building massing and geometry Building volume Individual levels of the building Schematic design Not investigated Schematic site design Surrounding buildings Building geometry Building volume Interior spatial arrangement Schematic facade design Schematic building structure Design development Not investigated Developed building site and surrounding buildings Infrastructure and transportation Building geometry Interior spatial arrangement and circulation Detailed facade design Detailed building structure Materials Furniture In this study, ten different evaluations were conducted to investigate the difference between AR and VR tools, their effects on design and communication protocols during different stages of the design process, and the perspectives of various participants, as shown in Figure 5.43. Each step involved evaluation of the AR or VR building model, which lasted approximately 30 minutes for every participant, followed by a survey (qualitative and quantitative), and interviews (for open-ended questions). For investigating student effectiveness, a survey was also administered before the evaluations to assess students’ familiarity with AR/VR tools. In the case of AR, the digital model was visualized within the physical environment by superimposing a 3D digital model in the real environment, and the walk-throughs were conducted by simply rotating the smartphone to visualize different aspects of the model. In the case of VR, each study participant was fully immersed within the VR environment, where they had an opportunity to “experience” the VR model. This immersive experience included visualization of the VR model (the scale, building geometry, surrounding buildings, building structure, etc.), as well as a walk-through within the site and the building. Surveys included different questions for different participants, but all used a 10-point rating scale to investigate these following aspects: Figure 5.44 shows specific survey questions that were used to evaluate the impacts of VR during the different design stages (for the designer and the client), while Figure 5.45 shows questions for students. Figure 5.46 shows the results of AR evaluations conducted during the conceptual design, where the top part of the figure shows the results of a personal assessment (designer), and the bottom part of the figure shows the results for communication procedures (designer and client). The results of the personal assessment indicated that the use of AR at this stage was not very important for the designer. Although the workflow was simple and effective in terms of exporting model geometry from BIM and importing into AR software, the use of AR did not have a major impact on the design decisions. It was useful for visualizing the overall design concept and presenting it to others. The results of the interactive evaluation focusing on design communication showed that AR was beneficial for visualizing the overall site and scale of the building and its relationships to the surrounding context. However, it had limited use for resolving design problems. The results indicated that the AR is useful for understanding the overall building massing and relaying large-scale ideas to the client. The application of this technology in the early stages of the design process is similar to physical models, which are very typical in architectural education. The main benefit of AR is that digital models can be created automatically from BIM software and displayed in AR environments, thus saving time and resources compared to building physical models. The results of the interview indicated that AR would have been more useful for investigating different building forms, early design studies, and the overall building shape. Figure 5.47 shows the results of VR evaluations conducted during the different stages of the design process, considering the designer’s and client’s perspectives. The immersive nature of the VR and the ability to experience the building helped to provide an insight as to what would it be like to explore this architectural design in person. From the designer’s perspective, the primary benefit of using VR at this stage was the ability to explore and visualize the design, but it was not greatly helpful for making design decisions. The results of the interactive evaluation and communication procedures between the designer and client indicated that the primary benefits of using VR in the conceptual design stage are the ability to explore and visualize the scale of the building, its relationship to the site, the overall form, and movement through the building. The last aspect—the ability to experience the building from the perspective of a building occupant and circulate through the digital model as if moving through the real building—is the most important one, because no other visualization technique offers this capability. The client was more satisfied with the design, workflow, and navigation than the designer, while the designer gave higher scores for visualization and success. The results of the interviews indicated that VR would be more effective if it included materials, interior partitions, and many other details to represent the real design, which relates to schematic design and information that would typically be included in this design phase. The results for schematic design evaluations were much better and indicated that the designer was more satisfied with the VR model and its effect on design decisions than with the VR model for the conceptual design. The VR model was more developed and included the overall structure, interior partitions, building envelope treatment, and circulation elements (stairs and elevators). Therefore, the immersive experience was more beneficial since it was easier to notice design problems that would be difficult to notice in typical architectural drawings. The designer also indicated that understanding the building scale and relationships between different spaces was extremely helpful. The results of the interactive evaluation and communication procedures between the client and the designer indicated that the use of VR at this design stage was extremely helpful. The client provided the highest scores for all aspects of the evaluation, and the designer gave higher scores than in the personal assessment. The more complete model was beneficial for the client to fully understand the scale of the building, spatial organization, interior partitions, stairs, and circulation cores, etc. The client also indicated some design deficiencies, which were modified in the later stages of the design process. The final evaluations conducted during the design development implemented the most detailed VR model. The design issues raised during earlier stages were resolved, and the model was updated to reflect these changes. The immersive experience was the most convincing at this stage, because it was possible to fully explore all aspects of the VR model (integration of the building with the site and surrounding context, structural systems, building envelope design, circulation, etc.). The results of the personal assessment indicated that the designer was most satisfied with the use of VR during this stage of the design process, compared to earlier stages. From the client’s perspective, use of VR was slightly less effective than for the previous design stages. The results of the open-ended evaluations and interview indicated that this was caused by the lack of materials in the VR model and that the immersive experience would be more effective if all materials were properly displayed. The last part of the study investigated the effects of VR on students’ perception and design effectiveness. Two different surveys were distributed—the first before the immersive VR experience to investigate students’ familiarity with VR tools, their previous experiences, and their perspectives regarding the workflow and impacts on design, interest in these tools, and their perspectives regarding navigation and visualization. Then, students participated in the evaluations of the identical VR model, used for the previous step in the study (design development model). The second survey was administered to evaluate this immersive experience, followed by interviews and open-ended questions. Figure 5.48 shows the results of both surveys, where the data indicates average results for all participants. The top part of the figure shows “before” results, indicating students’ familiarity with the VR tools and perspectives on the effects of this technology on the design process. It was found that students were not greatly familiar with the VR tools and workflows, and they did not fully understand how VR tools can be used or navigated. Their initial thoughts were that these tools can benefit the design process, and that VR offers better visualization techniques compared to standard 2D or 3D architectural documents. Students also expressed great interest in learning these tools and applying them for their own design projects. The participants were fully immersed within the VR model used in this study (an identical VR model to that used for the design development explorations between the designer and the client), and then responded to a survey. Students’ responses indicated that they had a much better understanding of the workflow and data exchange between the design and VR software applications after the immersive experience, as well as navigation within the VR environment. Their perspective on the impacts of VR on design were identical to the “before” survey, where they indicated that the VR tools would be beneficial for the design process. Evaluations “after” the immersive experience confirmed this aspect. Moreover, students’ interest in VR tools increased after the immersive VR experience because they could visualize the model, explore, and understand the capabilities of VR software applications and implementation in architectural design. Figure 5.49 shows individual students’ responses as scatter plots. It is evident that many students were not familiar with the workflows associated with VR technologies but were aware of the benefits associated with the design process. Another aspect that received the lowest scores before the immersive evaluation was the navigation—students were generally not familiar with VR environments nor how to navigate VR models. Students were aware of the visualization potentials of VR technologies and were generally interested in these emerging digital technologies. After the immersive VR experience, students’ interest in VR technologies drastically increased. Also, their understanding of the workflow and navigation significantly improved. Students’ perspectives regarding the impacts of VR on the design process remained the same as before the immersive experience. Lastly, their understanding of the visualization capabilities of VR technologies slightly improved. The results of interviews and open-ended questions indicated that students very much appreciated being exposed to VR tools and expressed that they would start using these emerging technologies in their design projects, even if not required by studio instructors. The results of this study indicate that AR and VR tools are beneficial for the architectural design process and can advance architectural education. These benefits include improved team collaboration, improved communication, investigation of design mock-ups, and visual, immersive reviews. Specific results of various evaluations indicated that VR and AR tools are useful for visualizing building form, scale, and design elements, as well as understanding movement and circulation through the building. No other design representation method offers such an immersive experience and visualization of design elements nor an ability to move through a digital representation of a building. Therefore, these technologies can greatly benefit spatial cognition, design communication, and visualization of architectural projects. Intelligent facade systems can be defined as building enclosures that react to the exterior environment, adapt to environmental changes, regulate their performance and functioning (by self-regulation or by users), integrate smart materials and components, and, in some instances, provide renewable energy for building’s operation. Intelligent facade systems are an important aspect of advanced building technologies that can revolutionize our buildings and significantly improve their performance. This research focused on the development, design, evaluations, and applications of new, intelligent facade systems, which integrate thermoelectric materials (Aksamija et al., 2020, 2019). Thermoelectric materials are smart materials that can produce a temperature gradient when electricity is applied, exploiting the Peltier effect, or generate a voltage when exposed to a temperature gradient, utilizing the Seebeck effect. These types of materials can be used for heating, cooling, or power generation. Research and development has largely focused on thermoelectric modules (TEMs) that convert heat energy into electrical energy (Montecucco et al., 2012; Yilmazoglu, 2016) and novel TE materials that offer higher energy efficiency through nanoscale engineering (Snyder and Toberer, 2008). Heating and cooling modes can be switched by reversing the current direction. TEMs can offer low cost electricity without the use of mechanical parts or production of toxic wastes. Thermoelectric heating and cooling have several advantages over their conventional counterparts. The compact size of commercial TEMs, their light weight, reliability, lack of mechanical parts, and elimination of the need for chlorofluorocarbons (CFCs) make them environmentally friendly and appealing. But, applying thermoelectric systems for space heating and cooling remains much more challenging (Zhao and Tan, 2014). Few applications of TEMs in facade assemblies have been researched, proposed, or constructed. This has created a significant gap in knowledge of the potential architectural applications of TEMs. The research objective of this study was to investigate the potential integration of TEMs into building skin to create intelligent facade systems that utilize the temperature difference between the exterior environment to provide heating, cooling, and energy generation, as seen in Figure 5.50. The research questions that were addressed, as seen in Figure 5.51, are: Quantitative and experimental research methods, including modeling, simulations, prototyping, testing, and experiments were employed to address these questions as shown in Figure 5.51. Initially, two prototypes were designed and constructed, shown in Figure 5.52, with different configurations. These prototypes were first tested in ambient room conditions to measure the heating and cooling outputs of TEMs. Then, an experimental study was utilized to physically evaluate heating and cooling outputs, where a controlled thermal chamber was used to represent different exterior temperatures, and interior temperature was kept constant. Thermal imaging was used to measure the heating and cooling outputs under varying voltage and power supply. The results were promising and indicated that facade-integrated TEMs would provide sufficient heating and cooling. The coefficient of performance (COP) was numerically calculated based on the experimental results and compared to conventional HVAC systems. The next stage of the research focused on the integration of TEMs into various facade types, as well as implementation of these intelligent facade systems for commercial office spaces. Digital models were developed, and scaled physical prototypes of these systems were digitally fabricated. The last step of the research included simulations, where Computational Fluid Dynamic (CFD) analysis was performed to investigate optimal exterior wall coverage for maximizing heating and cooling output, as well as temperature distribution within the interior office space under different climatic conditions. The dimensions of the TEM were 0.16 in x 0.16 in (40 mm x 40 mm), drawing up to 12 V, and operating conditions ranged from -22°F (-30°C) to 181°F (83°C). The small heat sink in the first prototype included aluminum fins, measuring 0.16 in x 0.16 in x 0.04 in (40 mm x 40 mm x 11 mm), which were bonded on to both sides of the TEM with silicone based thermal pads. The second prototype included two larger heat sinks, measuring 4.7 in (120 mm), with four direct copper pipes for heat dissipation, connected with thermal paste to both sides of the TEM. The first testing was conducted in ambient conditions. An independent module without a heat sink, a module with a small heat sink, and both prototypes were tested with applied voltage of 1V increments. Results were measured using a thermal imaging camera, as well as a power supply. Thermal images were taken at one volt increments up to 8V, and temperatures were recorded using a thermal camera. The temperatures that were measured during ambient testing ranged from 49°F (9°C) to 258°F (126°C) in both cooling and heating modes. The results also indicated that the small heat sinks in the first prototype were not as effective for heat dissipation; therefore, the second prototype was selected for further testing as a better performing system. Further testing involved the use of a temperature controlled thermal chamber. The thermal chamber’s opening was sealed using insulating foam with tape applied to provide a relatively air-tight seal for the testing. The prototype was inserted into the chamber and sealed again, as seen in Figure 5.53. The chamber was set to 90°F, 60°F, 30°F, and 0°F (32°C, 16°C, -1°C, and -18°C) to represent different exterior temperatures (winter, summer, and intermediate seasons). This method of testing represented typical exterior temperatures found in most climates while allowing for temperature data to be collected in a controlled setting. The heating mode was tested under 60°F, 30°F, and 0°F (16°C, -1°C, and -18°C) conditions, while the cooling mode was tested under 90°F and 60°F (32°C and 16°C). The thermal chamber was allowed time to stabilize (1 hr) before each testing session, and 20-minute breaks were taken in between each measurement. The ambient temperature of the room was kept relatively stable at 73°F. Voltage was applied in 1 V increments in both heating and cooling modes. Temperature measurements on the exterior surface of the prototype were recorded using a thermal camera. Table 5.6 shows results for the heating mode and Table 5.7 for the cooling mode. The results show that TEMs operate at effective heating and cooling temperatures even when exposed to variable exterior temperatures, represented by the thermal chamber. TABLE 5.6: Results of thermal chamber testing (heating mode). TABLE 5.7: Results of thermal chamber testing (cooling mode). The next step of the research focused on the design, modeling, and physical prototyping of real facade systems that would integrate thermoelectric materials. Figure 5.54 shows digital models of various facade systems. In all cases, the exterior heat sinks are seamlessly integrated into the exterior cladding since aesthetic considerations are important for any facade design. For example, aluminum fins can be used as exterior shading devices, but also as an external heat sink, connected to the TEMs with a copper conducting system and an interior heat sink (a radiant panel). Aluminum cladding in a rainscreen application can be used as an exterior heat sink. Lastly, in a curtain wall application, an aluminum panel, acting as exterior heat sink, can be integrated into the spandrel area. In all three cases, a radiant panel is placed on the interior side and would provide heating and cooling. Also, the facade-integrated TE system would be installed as a modular piece and would be insulated from the rest of the exterior wall. The modular nature of this system would be suitable for all building types, as well as retrofits of existing buildings. Figure 5.55 shows scaled physical prototypes of these systems, which were digitally fabricated using 3D printers and laser cutting. These prototypes were used for visual evaluations. Figure 5.56 shows full scale working physical prototypes. The last part of the study investigated the heating and cooling potentials of these novel systems for conditioning commercial office spaces. A typical commercial office space was used in the simulation study to investigate heating and cooling capabilities. In the simulation model, a single office space was modeled with an exterior wall consisting of a thermoelectric facade and interior walls as adiabatic partition walls. CFD simulations were conducted for different scenarios, using the SOLIDWORKS software program, varying the exterior environmental conditions and the percentage of wall coverage with thermoelectric components (5%, 10%, 15%, and 20%). The exterior temperature was identical to the experimental study, considering temperatures of 90°F, 60°F, 30°F, and 0°F (32°C, 16°C, -1°C, and -18°C). Simulations were conducted to calculate temperature distribution within the interior space for these different scenarios, and to determine heating and cooling outputs. Results of the 20 simulated scenarios indicated that 15% TE wall coverage was the most efficient option both for heating and cooling purposes within the simulated space. Examples of results are shown in Figure 5.57. The results of this research indicated that TE materials are promising intelligent components that can be used in facade assemblies for heating and cooling purposes, controlling buildings’ interior environments. This is an independent system that does not require moving parts or harmful substances and solely relies on the temperature difference between the interior and exterior environments to operate. It relies on the capabilities of TEs to warm up in heating mode and cool down in cooling mode, when exposed to temperature differences between the inside and outside. However, a separate ventilation system would still be needed for the interior space, which cannot be provided by the stand-alone facade-integrated TEs. Maintenance of TE systems is easier than the conventional HVAC systems because they can be treated as individual components, with no need to shut down the whole system. Furthermore, they can be used as a personalized system which occupants of each room within the same building can use based on personal preferences.
5 Case Studies
5.1 Qualitative and Quantitative Research for a Historically Significant Building: Building Performance Analysis of a Brutalist Building
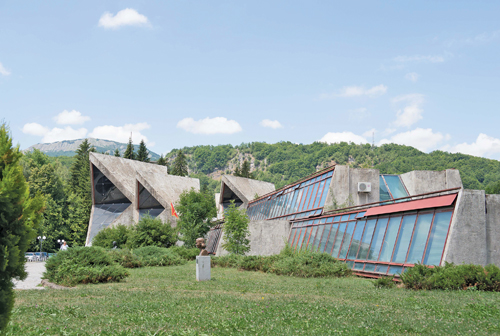
Spomen Dom, current state. Courtesy of Sunčica Milosević.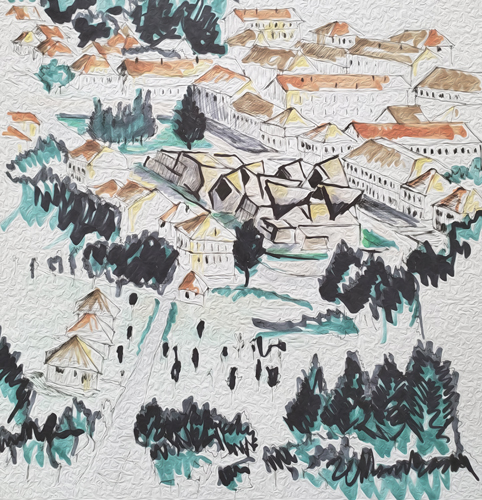
Spomen Dom and sketch of its surrounding context.
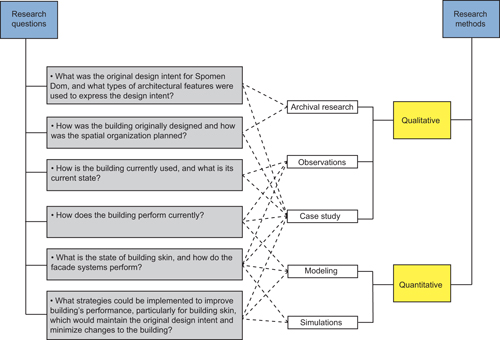
Overview of research questions and research methods.
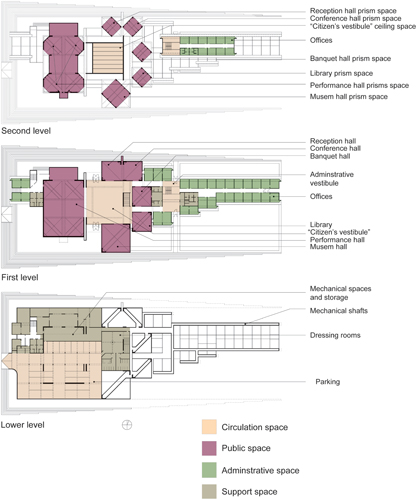
Floorplans of Spomen Dom, according to original design intent, and spatial organization. Courtesy of Sunčica Milosević.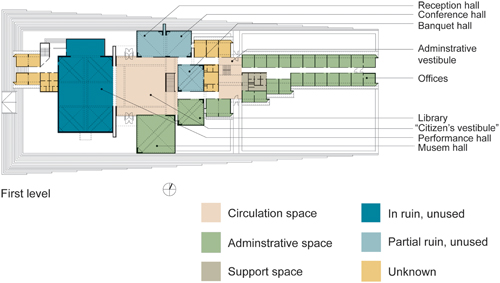
Floorplan of Spomen Dom’s first level, as currently used. Courtesy of Sunčica Milosević.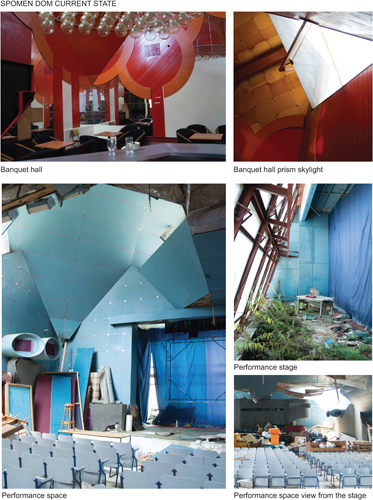
Spomen Dom, current state of the interior spaces. Courtesy of Sunčica Milosević.
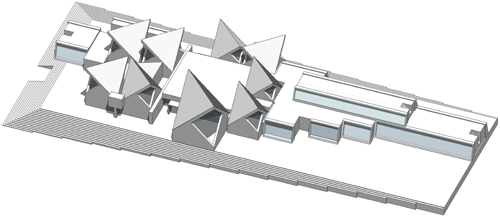
BIM model of Spomen Dom. Courtesy of Sunčica Milosević.
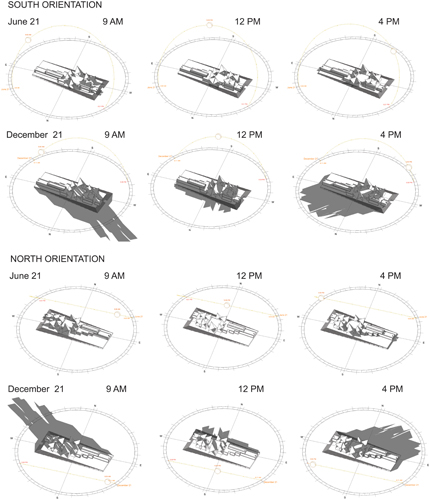
Shadow analysis. Courtesy of Sunčica Milosević.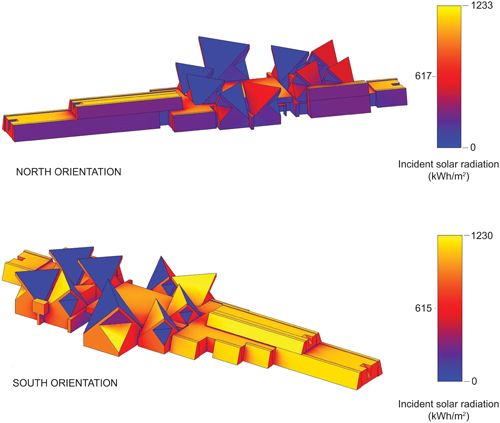
Solar radiation analysis. Courtesy of Sunčica Milosević.
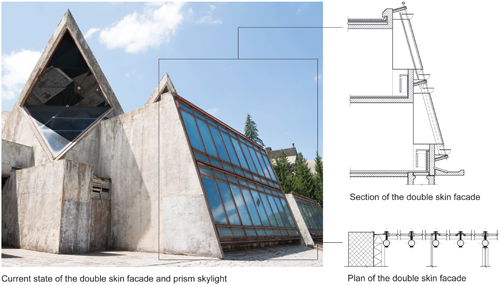
Double skin glazed facade, and its current state. Courtesy of Sunčica Milosević.
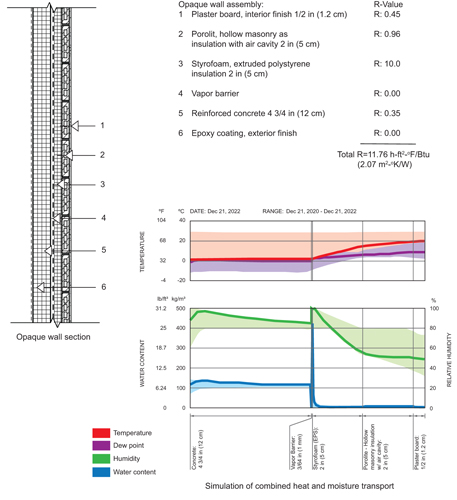
Typical concrete exterior wall assembly, thermal resistance, and simulations of combined heat and moisture transport. Courtesy of Sunčica Milosević.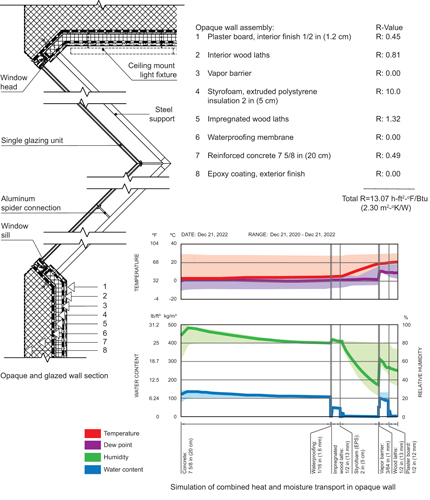
Typical prism exterior wall assembly, thermal resistance, and simulations of combined heat and moisture transport. Courtesy of Sunčica Milosević.
5.2 Qualitative and Quantitative Research for Adaptive Reuse: Designing for Net-Zero Energy
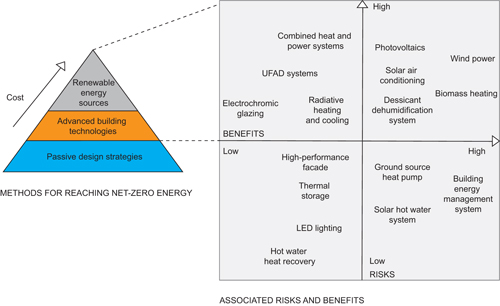
Design methods for achieving net-zero energy in buildings, and associated benefits and risks.
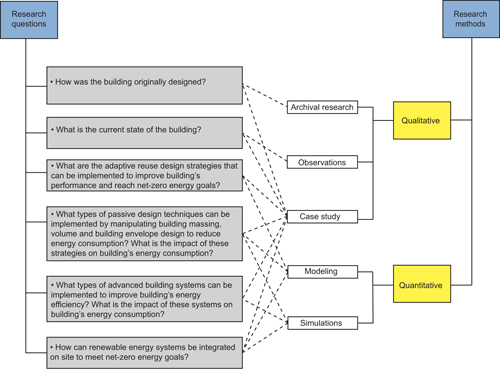
Overview of research questions and research methods.
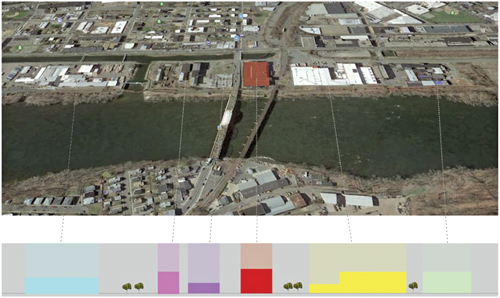
Surrounding context of the case study building.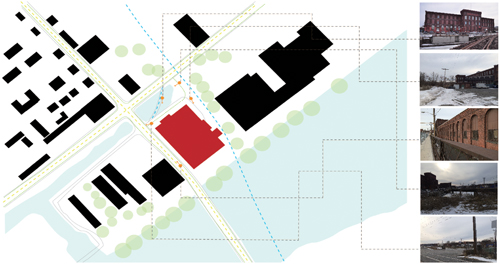
Site plan and current state of the building.
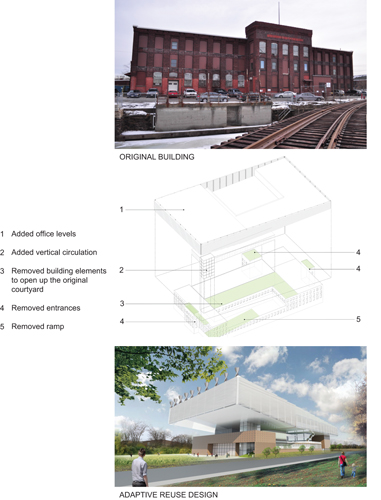
Comparison of the original building and its adaptive reuse design, outlining major changes to the building.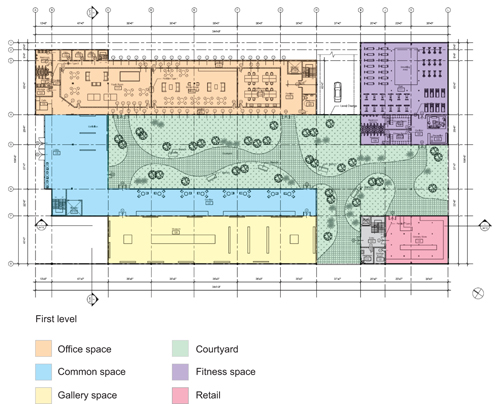
Floorplan of the first level, showing the new building program.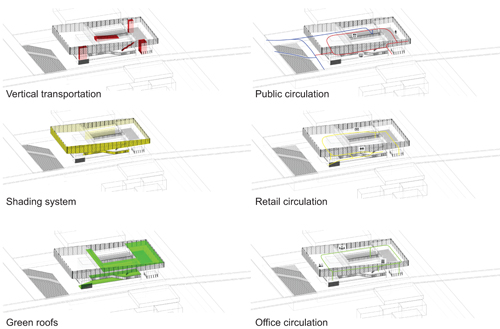
Adaptive reuse building diagrams. Courtesy of Yi Wang Vizard.
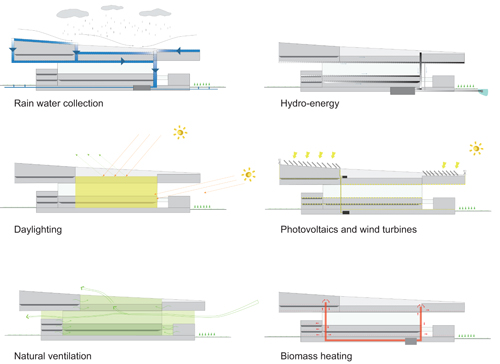
Sustainable adaptive reuse design strategies and renewable energy sources. Courtesy of Yi Wang Vizard.
Energy model and results for the baseline scenario (initial adaptive reuse design) and the alternative simulation run.
Renewable energy systems production for meeting net-zero energy goals.
5.3 Quantitative Research for Building Systems: Comparative Analysis of Facade Systems and Impacts of Climate Change
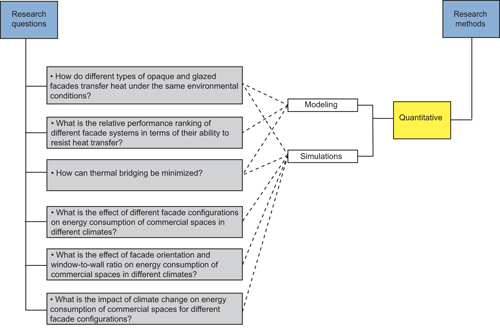
Overview of research questions and research methods.
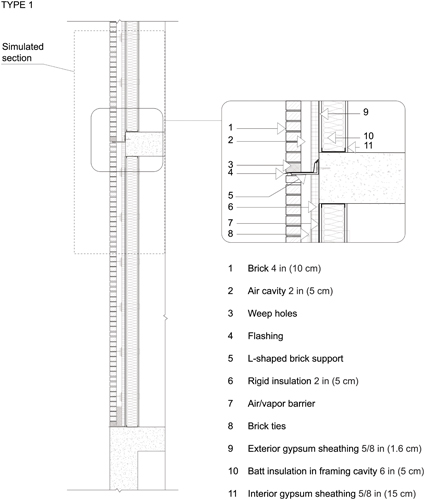
Overall section, material components, and simulated section for Type 1 facade system (brick cavity wall with metal framing).
Overall section, material components, and simulated section for Type 2 facade system (rainscreen facade with terracotta cladding and metal framing).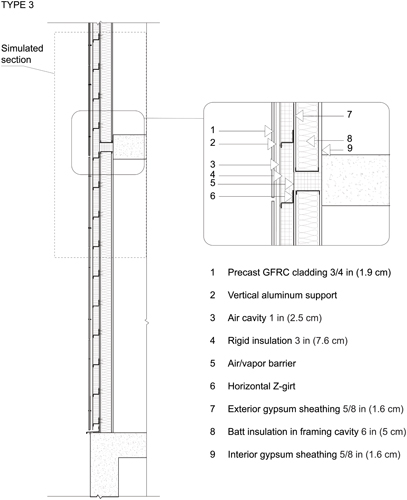
Overall section, material components, and simulated section for Type 3 facade system (rainscreen facade with glass-fiber reinforced concrete cladding and metal framing).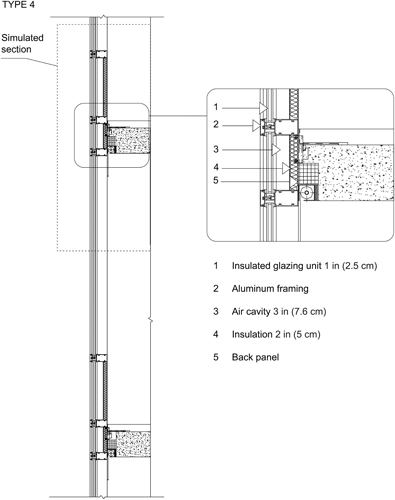
Overall section, material components, and simulated section for Type 4 facade system (curtain wall with aluminum framing).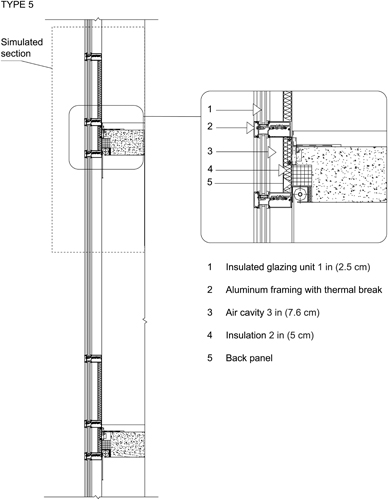
Overall section, material components, and simulated section for Type 5 facade system (curtain wall with thermally broken aluminum framing).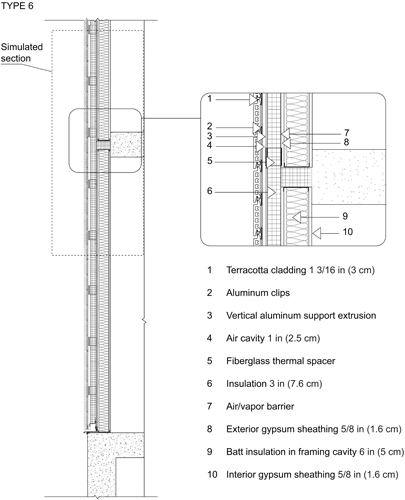
Overall section, material components, and simulated section for Type 6 facade system (rainscreen facade with terracotta cladding and thermal spacers).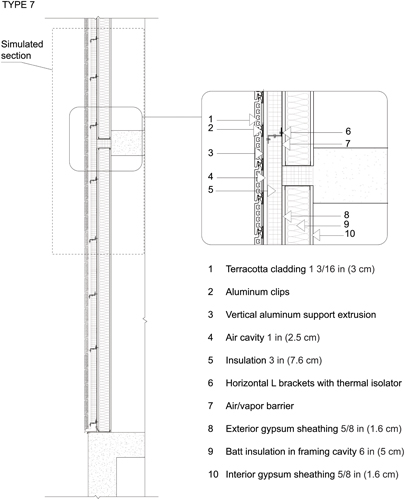
Overall section, material components, and simulated section for Type 7 facade system (rainscreen facade with terracotta cladding and thermal isolators).
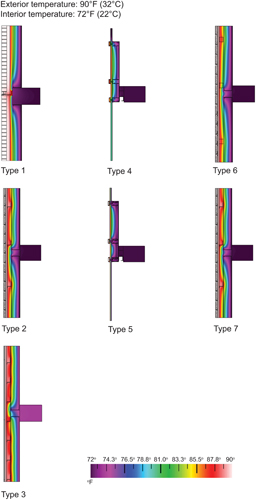
Results of thermal modeling, indicating thermal gradients within all facade systems, under exterior temperature of 90°F (32°C).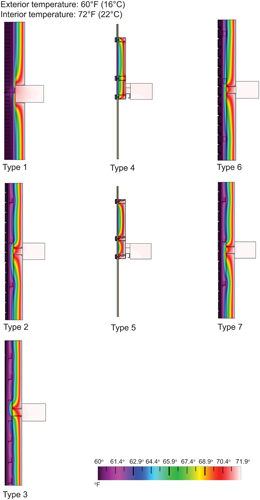
Results of thermal modeling, indicating thermal gradients within all facade systems, under exterior temperature of 60°F (16°C).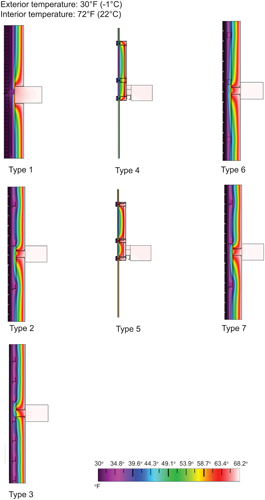
Results of thermal modeling, indicating thermal gradients within all facade systems, under exterior temperature of 30°F (-1°C).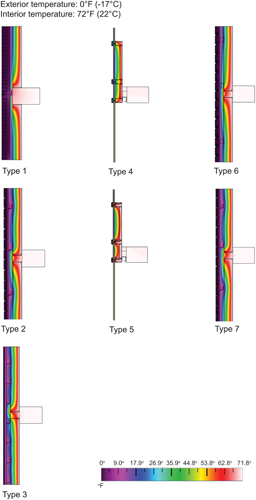
Results of thermal modeling, indicating thermal gradients within all facade systems, under exterior temperature of 0°F (-18°C).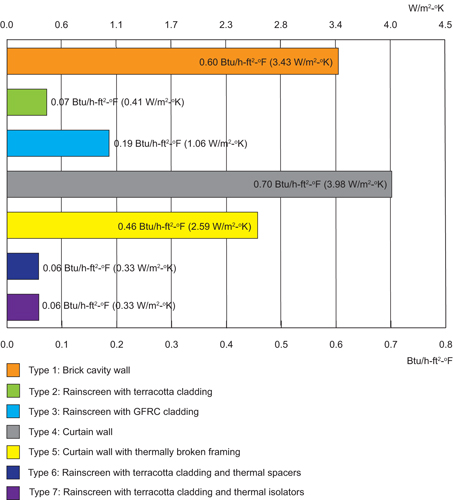
Comparison of calculated U-values for all facade systems.
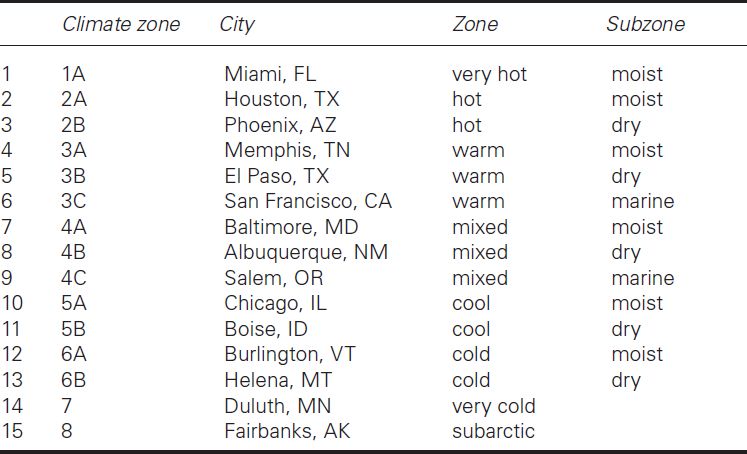
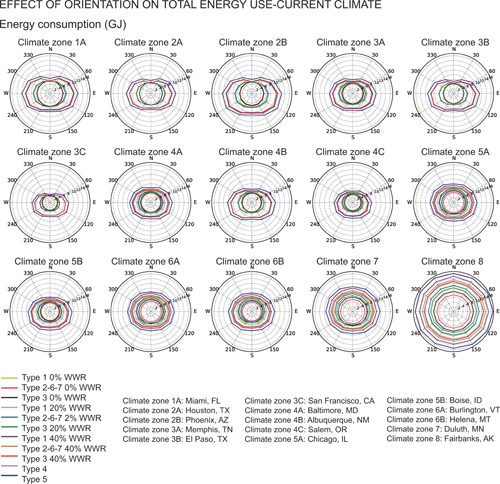
Effects of orientation and different window-to-wall ratios on energy consumption for investigated facade types in different climates.
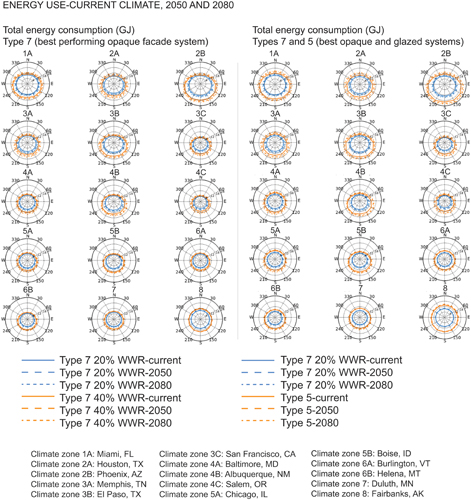
Impacts of climate change on total energy consumption for best thermally performing opaque and glazed facade systems.
Impacts of climate change on heating and cooling loads for best thermally performing opaque and glazed facade systems.
5.4 Qualitative, Quantitative, and Experimental Research for the Design Process: Integration of Augmented and Virtual Reality with Design
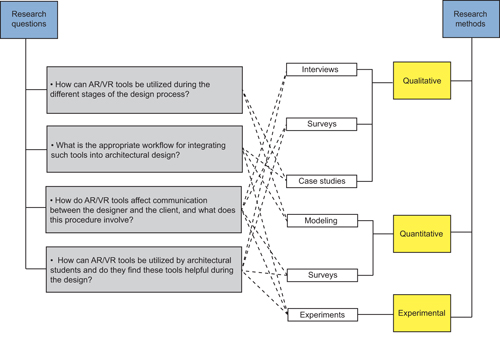
Overview of research questions and research methods.
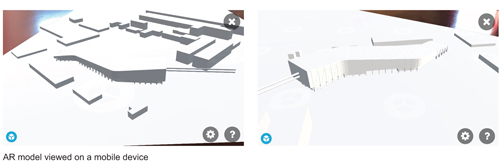
AR model.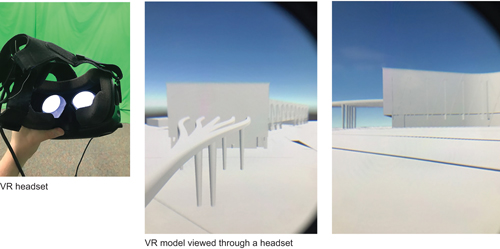
VR headset, and VR model visualization.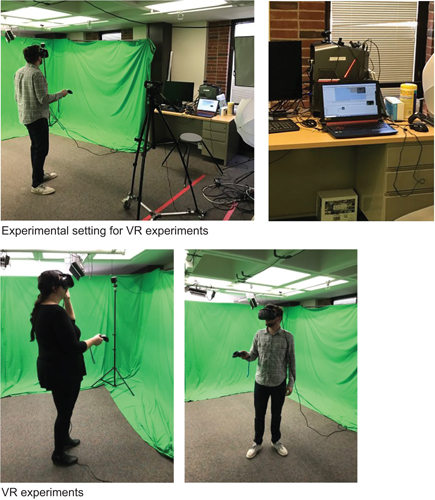
Experimental setting for VR experiments.
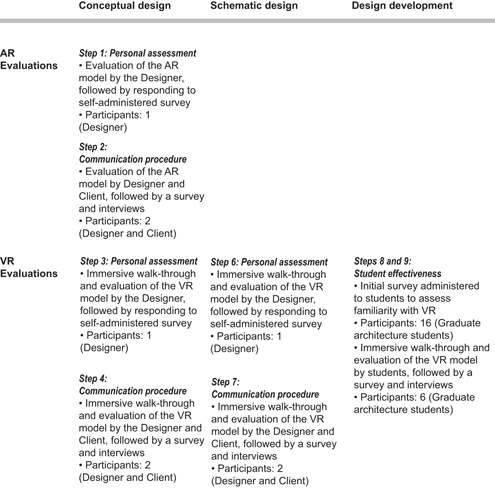
Evaluations and research procedures.
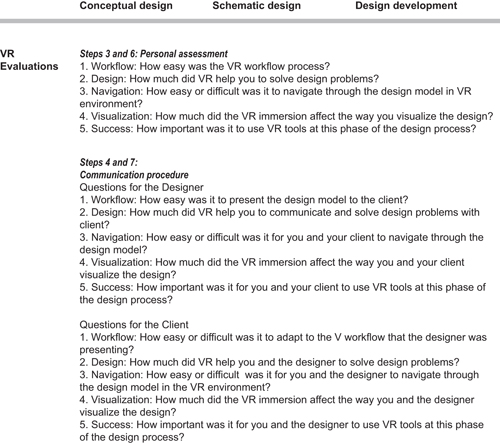
Example of surveys questions for VR evaluations (designer and client).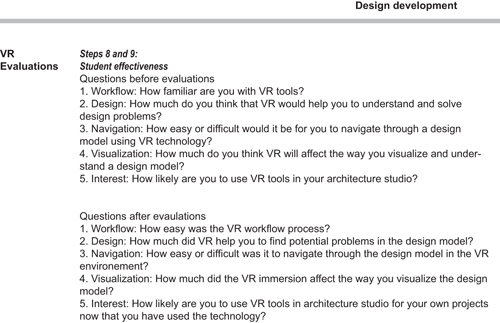
Example of surveys questions for VR evaluation (students).
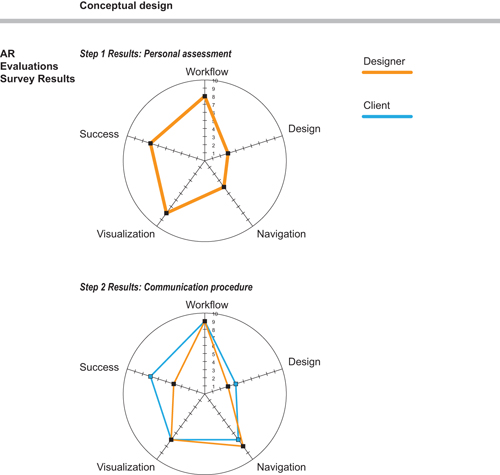
Results of the AR evaluation.
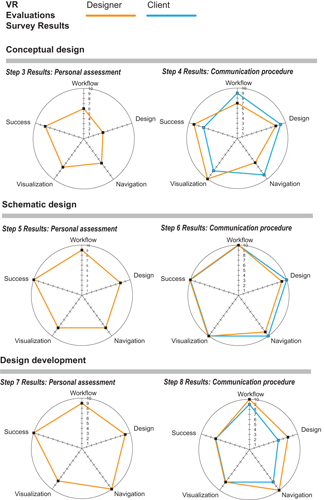
Results of the VR evaluations.
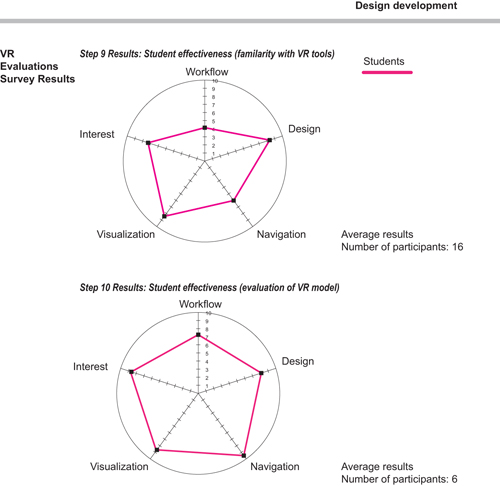
Results of the VR evaluations (students’ perspective), conducted before and after immersive VR experience.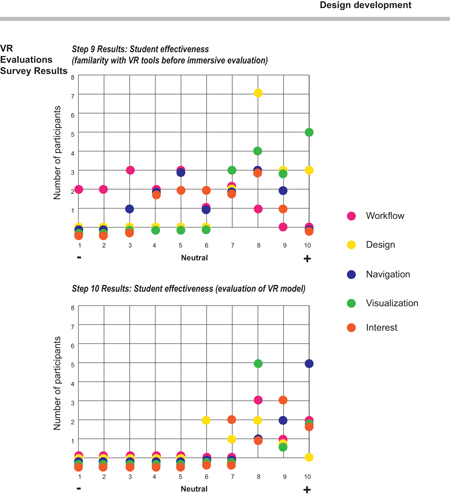
Individual students’ surveys responses, before and after immersive VR experience.
5.5 Quantitative and Experimental Research: Intelligent Facade Systems
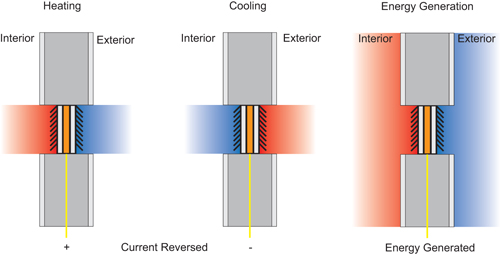
Concept of an intelligent facade system with integrated thermoelectric materials, which provide heating, cooling, and energy generation.
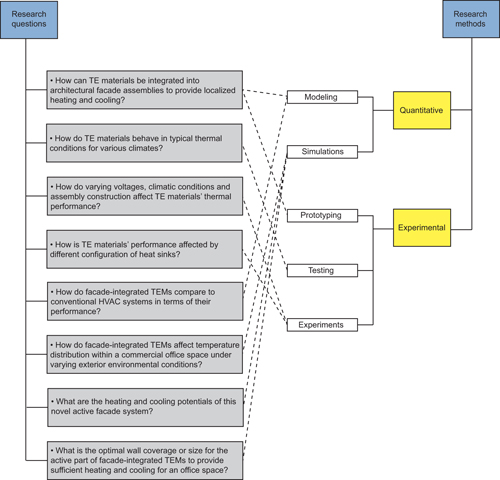
Overview of research questions and research methods.
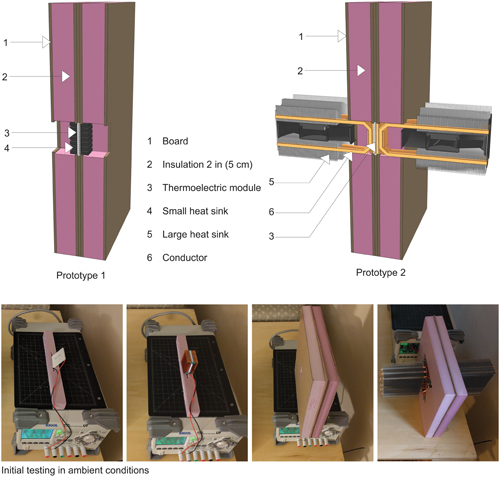
Initial prototypes and testing in ambient conditions.
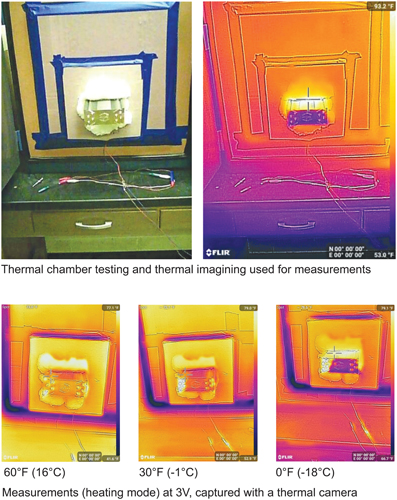
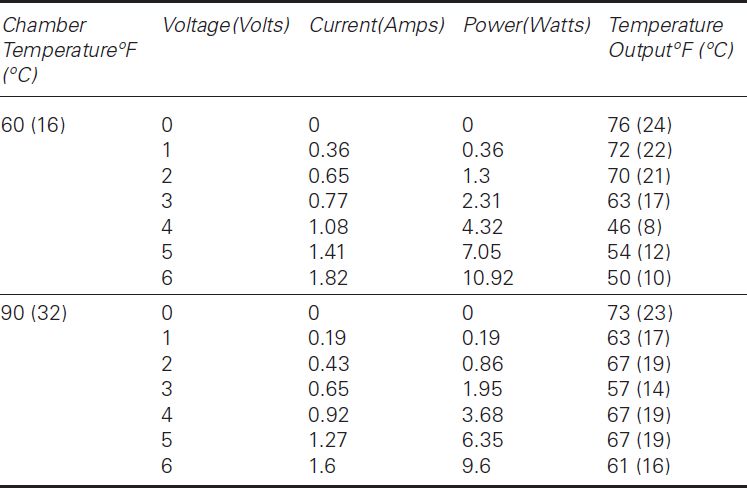
Thermal chamber experimental set-up, and examples of measurements.

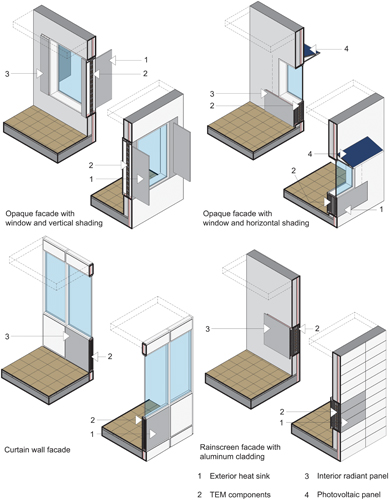
Digital models of different facade types with integrated thermoelectric components.
Physical scaled prototypes of different facade types with integrated thermoelectric components, digitally fabricated.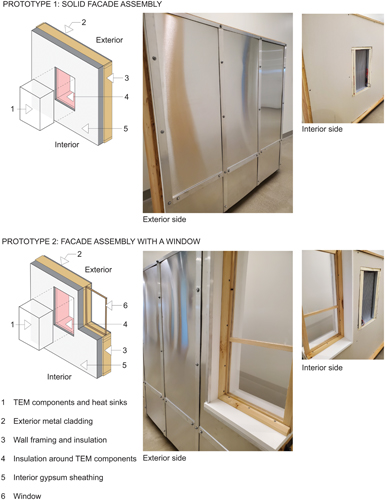
Physical full scale, working prototypes of facade systems with integrated thermoelectric components.
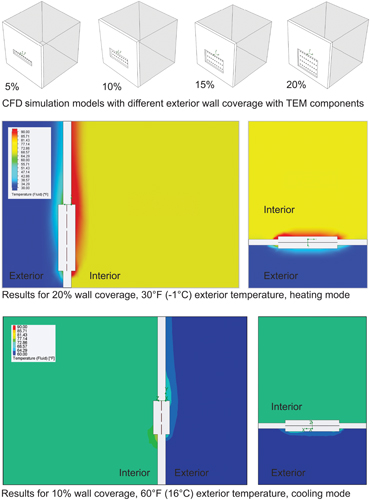
CFD models and examples of simulation results.
References