AMPLITUDE IS THE CHARACTERISTIC of sound that we are usually interested in measuring – “how loud” – and it can be measured as a whole or at a specific frequency or frequency band.
Human ears are very complex and don’t have a flat response to sound either in frequency or sound pressure level. We have already talked about the use of decibels to explain sound pressure levels instead of the absolute units of sound pressure; we have also discussed the varying sensitivity of our ears in terms of frequency.
IN CHAPTER 1 WE TALKED ABOUT sound amplitude being expressed in Pascals. This unit is not practical due to the enormous pressure range over which humans are able to sense sound. From the tiny pressure waves caused by the flapping of a bee’s wings to the massive pressure waves created by the launch of Saturn 5 Rocket, it can be imagined how difficult it would be to plot these two pressure levels on a single graph (about seven orders of magnitude in pressure). At the same time, the perceptual response of human ears to sound amplitude is not linear but logarithmic. These are the reasons why the decibel scale was chosen to represent Sound Pressure Level (SPL or Lp). It is a comparison between the amplitude of a sound and that of the faintest audible sound for a human ear. The threshold of hearing is, of course, different for every single person but it was determined that, at 1 KHz, the average human threshold of hearing is about 2 × 10⁻⁵ Pa. The Sound Power can be derived from Lp+10logS where S is the surface area of the sound wave (see Appendix A for more detail).
6.1.1 Human perception of loudness
As mentioned earlier, our ears do not respond to sound in a linear way. When we convert a sound pressure value to SPL in dB, we see that 3 dB are twice the sound pressure. However, 3 dB do not sound twice as loud to our ears. Instead, an increase of about 10 dB is necessary to produce a sound that we’d consider twice as loud; 5 dB, a noticeable difference; and 3 dB, only barely a noticeable difference.
IN AN ATTEMPT TO CREATE a unit that could be used to measure sound, but at the same time represent what our ears are actually receiving (after all, why else do we want to measure sound if it isn’t to see how it affects us?), the weighting curves were created. Figure 6.1 shows curves A, B, C, and D, used to weight sound pressure levels in decibels in order to better represent human hearing.
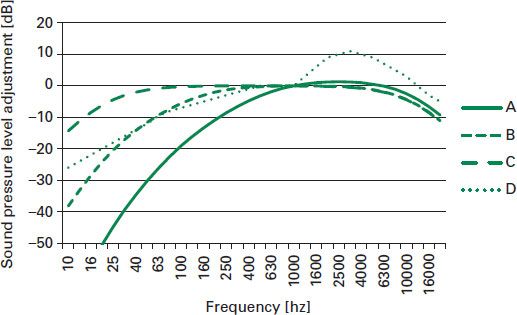
6.1 Weighting curves
6.2.1 A-weighting
The lowest curve was created to weight sounds at about 40 phons; however, this curve has been widely spread to the point where it is used nowadays to weight any sound. Environmental noise standards and noise ordinances use it instead of the flat response sound pressure level value, and sound level meters have the option of reading levels in dBA as well as dB, dBA being the preferred unit.
6.2.2 B and D-weighting
B-weighting was created to weight sounds at about 70 phons, but it is no longer used. D-weighting was created to weight the noise of aircraft and it is rarely used, while A-weighting is also the common one for aircraft measurements.
6.2.3 C-weighting
This curve is still used by some sound level meters instead of a flat response, but the use of a Z-weighting curve is becoming more common to replace the non-weighted measurements. “Z” stands for “zero” weighting.
WHEN EXTERNAL AND INTERNAL NOISE LEVELS are measured, it is normal for a descriptor to be used which helps to define the period over which the measurement was taken and what part of the measured noise is being assessed. We may simply require an average of the noise level measured over a specific time period (Leq), or we may wish to know what the underlying background noise level is (L90). Listed below are some common noise descriptors used in the measurement of environmental noise.
LAeq (1hour): A one-hour measurement of the LAeq often used in daytime industrial noise assessments.
LAeq (16hour): A 16-hour-long measurement of the LAeq used to describe the period between 7:00 AM and 11:00 PM.
LAeq (8hour): An eight-hour-long measurement of the LAeq used to describe the period between 11:00 PM and 7:00 AM.
LDEN: A 24-hour-long measurement used to determine the day (7:00 AM–7:00 PM), evening (7:00 PM–11:00 PM), and night (11:00 PM–7:00 AM).
LAmax: The highest single noise event measured over the duration of a survey. Usually associated with a sudden increase in noise such as a train passing
LAmin: The lowest or minimum noise level measured over the duration of a survey. Usually associated with the quietest moment during the survey.
LA90: For some noise sources, such as industrial noise affecting a dwelling, it is common to attempt to control noise in line with the background noise level (LA90). This is the underlying noise level or the average noise level which is exceeded for 90 percent of the measurement period. This allows for noise to be assessed against the quiet periods or lulls in average noise levels, to ensure that a disturbance is not created – i.e., the periods between vehicles passing by a dwelling will result in quiet passages of time where the noise under consideration (industrial noise) may not be masked by other events (road traffic noise) and so cause a disturbance.
LA10: This is the noise level that is exceeded for 10 percent of the duration of the measurement. It is useful for defining noise from road traffic sources, as it focuses on noise when vehicles are passing, rather than including any lulls that may occur between pass-bys. As with LAeq measurements, the duration of the measurement is often used such as LA10 (3hour), which can be used for short measurements of road traffic noise or LA10 (18hour), which can be used for day and evening road traffic measurements used to define the period between 6:00 AM and 12:00 AM.
DETAILING THE CORRECT PERFORMANCE PARAMETER for separating partitions is an increasingly complex task, due to variations in national requirements, guidance documents, and client specification briefs. Different terms are often used to define acoustic insulation, so, for example, airborne laboratory tests on a sample partition are normally defined as the “STC” in North America and Australasia, while the “Rw” term is more commonly used in Europe.
Simply stating a dB requirement for the acoustic insulation of a partition is inadequate, as it does not describe the method by which the partition is to be assessed and can lead to substantial differences in actual performance (e.g., the difference in on-site performance between specifying a partition with a DnTw of 50 dB compared to a partition with a DnT,w+Ctr of 50 dB can be more than 10 dB). Therefore it is necessary to state the performance parameter (STC, Dn,Tw, R’w, etc.) as well as the performance criteria (45 dB, 50 dB, etc.).
6.4.1 Commonly used performance parameters
The most commonly used parameters are listed in Table 6.1, which also outlines what they mean and where they are used.
Table 6.1 Most commonly used sound insulation parameters
Parameter | Definition | Commonly used |
Airborne sound insulation parameters | ||
STC | North America, New Zealand | |
FSTC | North America, New Zealand (field testing) | |
Rw | The weighted sound reduction index of a partition. Gives a single number value based on the performance of a partition to reduce noise between two rooms across a set range of frequencies (100 Hz to 3150 Hz). The calculated level is adjusted for the effects of room reverberation and background noise. The calculation takes into account room and partition size. (ISO 140-3 1995/ISO 717-1 1997) | Europe (flanking suppressed lab testing) |
R’w | The apparent sound reduction index of a partition. Gives a single number value based on the performance of a partition to reduce noise between two rooms across a set range of frequencies (100 Hz to 3150 Hz). The calculated level is adjusted for the effects of room reverberation. The calculation takes into account the room and partition size. (ISO 140-4 1998/ISO 717-1 1997) | Europe (flanking laboratory or on-site testing) |
ΔRw | The difference between two measured weighted sound reduction indices. Used to determine the performance of acoustic treatments to a standard core wall or floor. Used to define the performance of acoustic treatments such as floating floor systems. (ISO 140-16 2006/ISO 717 1997) | Europe (flanking suppressed lab testing) |
DnT,w | The weighted level difference in airborne sound. Used to determine on site performance and measured across the 100 Hz to 3150 Hz frequency range. The result is adjusted for background noise and room reverberation. The result assumes a standard room and partition size. (ISO 140-4 1998/ISO 717-1 1997) | Scotland, Eire, Austria, Belgium (on-site testing) |
DnT,w+C | The weighted level difference in airborne sound that is then adjusted with a C-weighting spectrum adaptation term to place more emphasis on low frequency performance. Used to determine on-site performance and measured across the 100 Hz to 3150 Hz frequency range. The result is adjusted for background noise and room reverberation. The result assumes a standard room and partition size. (ISO 140-4 1998/ISO 717-1 1997) | France, Switzerland (on-site testing) |
DnT,w+Ctr | The weighted level difference in airborne sound that is then adjusted with a Ctr spectrum adaptation term to place more emphasis on low frequency performance. Used to determine on-site performance and measured across the 100 Hz to 3150 Hz frequency range. The result is adjusted for background noise and room reverberation. The result assumes a standard room and partition size. (ISO 140-4 1998/ISO 717-1 1997) | Australia, England, Wales (on-site testing) |
Dw | The weighted level difference in airborne sound between two rooms. The level is not adjusted for the effects on room reverberation. (ISO 140-4 1998/ISO 717-1 1997) | UK offices, commercial buildings (on-site testing) |
Impact sound insulation parameter | ||
IIC | Impact insulation class. Used to determine the ability of a floor/ceiling to control the transmission of impact or structure-borne noise (e.g., footfall). Measured across the 100 Hz to 3150 Hz frequency band. Only measurements of the noise level in the receiving room are made and so the IIC value is calculated by subtracting the measured level from a base criterion of 110. Hence the larger the IIC value, the better. (ASTM E989-06, 2012/ASTM E492) | North America, New Zealand (flanking suppressed lab testing) |
FIIC | Field impact insulation class. Used to determine the ability of a floor/ceiling to control the transmission of impact or structure-borne noise (e.g., footfall). Measured across the 100 Hz to 3150 Hz frequency band. Only measurements of the noise level in the receiving room are made and so the IIC value is calculated by subtracting the measured level from a base criterion of 110. Hence the larger the IIC value, the better. (ASTM E989-06, (2012)/ASTM E1007-13b) | North America, New Zealand (flanking suppressed lab testing) |
Lnw | The weighted normalized level from sound being transmitted through a floor or ceiling as a result of impact sound energy being transmitted into the floor using a tapping machine. Measured across the 100 Hz to 3150 Hz frequency band and adjusted for background and room reverberation The calculation takes account of the room and partition size. (ISO 140-6 1998/ISO 717-2 1997) | Europe (flanking suppressed lab testing) |
L’nw | The weighted normalized level from sound being transmitted through a floor or ceiling as a result of impact sound energy being transmitted into the floor using a tapping machine. Measured across the 100 Hz to 3150 Hz frequency band and adjusted for background and room reverberation. The calculation takes account of the room and partition size. (ISO 140-7 1998/ISO 717-2 1997) | Denmark, Iceland, Italy (on-site testing of floors) |
L’nT,w | The weighted standardized impact sound pressure level. Used to determine the on-site performance of a floor or ceiling to control impact sound being transmitted from a tapping machine. The level is adjusted for background noise and room reverberation. The calculation assumes a standard room and partition size. (ISO 140-7 1998/ISO 717-2 1997) | Austria, France, UK (on-site testing of floors) |
ΔLw | The difference between two measured weighted normalized level indices. Used to determine the performance of acoustic treatments to a standard core floor. Used to define the performance of acoustic treatments such as floating floor systems. (ISO 140-8 1998/ISO 717-2 1997) | Europe (flanking suppressed lab testing) |
Ceilings and small openings | ||
Dn,F,w/DnF,n | The weighted level difference between two rooms either side of a partition to show the effects of adding a treatment to a flanking element, e.g. a ceiling lining or floor lining. Often quoted by ceiling tile manufacturers. (BS EN 20140-9 1994/ISO 717-1 1997) | Europe (flanking lab testing) |
Dn,e,w | The weighted level difference between two rooms either side of a partition which includes a small test element, e.g. a vent or grill. Indicates the acoustic performance of a small element set into a wall or façade, commonly used to show performance of wall vents. (ISO 20140-10 1992/ISO 717-1 1997) | Europe (flanking suppressed lab testing) |
6.4.2 Understanding performance parameters
The level of insulation required is set as a performance criterion and stated in dB. For example, if we were to be undertaking sound insulation testing in dwellings in England and Wales, then the performance parameter is DnT’w+Ctr but if we were testing in the United States the performance parameter is likely to be FSTC. In addition to these national variations, there are also differences in the way that sound insulation is defined. As Table 6.1 outlines, there are airborne performance requirements and impact performance requirements. Airborne requirements are set for walls and floors and look at controlling airborne sources such as speech, television, or music noise. Impact performance requirements look at controlling footfall noise created in an upper dwelling in a block of flats or apartments. However, it should be noted that in some countries there are requirements to control horizontal impact sound, e.g., footfall noise from one room to another either side of a wall.
Care should also be taken when applying impact performance requirements. For airborne sound, it is generally the case that the higher the result, the better the wall or floor has performed, but for impact sound there is significant variation dependent on the performance parameter.
Where the terms “IIC” or “ΔLw” are used, this indicates that the higher the value, the better the performance.
For all other instances (L’nT,w, L’nw), the lower the performance, the better the floor has performed.
Table 6.2 details the perceived relationship between the level of sound insulation offered by a partition and how speech would be perceived in the adjoining room.
It should also be noted that the perceived level of acoustic insulation can be affected by the ambient noise level within a room. Where ambient noise levels in the receiving room are higher, as you may expect in an open plan office or a room next to a busy road, then audible speech from an adjoining room will be limited due to natural masking sound created by other sources. Figure 6.2 shows expected perceived levels for speech from an adjoining room dependent on the insulation of the wall and the steady ambient noise level within the receiving room.
6.4.3 Converting from laboratory testing to on-site testing
It is often necessary to have an idea of how well a total system (i.e., a wall or a floor) will perform when in situ, based on its laboratory performance.
Table 6.2 Perceived relationship between sound insulation values and speech
Description | STC/Rw |
Talk at a normal level can be heard and followed in the room next door. | 37 |
Talk at a normal level can be heard and partly distinguished in the room next door. | 42 |
Talk at a normal level can be heard, but words cannot be distinguished in the room next door. | 47 |
Talk at a normal level cannot be heard in the room next door. | 52 |
Loud speech can be heard through the wall but words cannot be distinguished. | 57 |
Loud speech cannot be heard through the wall. | 62 |
Loud shouting can be heard through the wall, but words cannot be distinguished. | 67 |
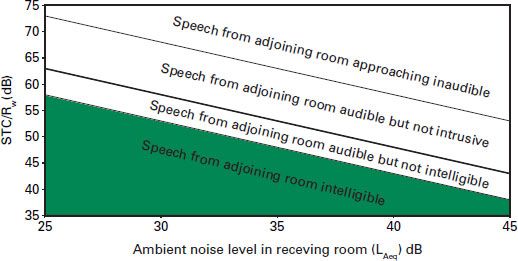
6.2 Relationship between sound insulation of a partition and ambient noise level
The following rules of thumb are normally applied when converting site performance requirements to laboratory performance levels:
Site FSTC = Lab STC –5 dB for masonry partitions
Site FSTC = Lab STC –7 dB for lightweight partitions
Site DnT,w = Lab Rw –5 dB for masonry partitions
Site DnT,w = Lab Rw –7 dB for lightweight partitions
Site DnT,w+Ctr = Lab Rw +Ctr –10 dB for masonry partitions
Site DnT,w+Ctr = Lab Rw +Ctr –15 dB for lightweight partitions
Table 6.3 Noise criteria and noise rating curves compared
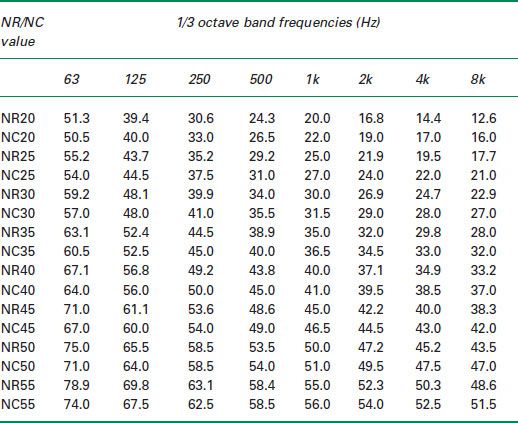
NOISE CRITERIA (NC) CURVES ARE USED in North America, while Noise Rating (NR) Curves are more commonly used in the United Kingdom. Both provide a set of performance values between 63 Hz and 8000 Hz at 1/3 octave bands, which can be used to set performance targets for noise sources that may have a significant frequency component. For example, a fan may have an average noise level LAeq of 40 dB; however, when each frequency band is considered, it is possible that there is a significant spike in the noise level at, say, 100 Hz. The low noise levels across the other frequency bands therefore average out this spike when considered against an average noise criterion. By setting a performance curve across a frequency range, potentially disturbing noise sources can be identified, controlled, or avoided. NC and NR curves are used primarily when assessing noise from HVAC or noise sources that are likely to have a significant tonal component, such as electrical substations. The aim would be to control noise from a particular source so that it is below the NC or NR criteria at each frequency band. Table 6.3 details the most often used NC and NR curves and compares each set. It should be noted that there are minor differences between NC and NR curves with the same numerical value – for example, NC25 and NR25.
Classification for rating sound insulation. ASTM E413-10. West Conshohocken, PA: ASTM.
Standard test method for measurement of airborne sound attenuation between rooms in buildings. ASTM E336-11. West Conshohocken, PA: ASTM.
Standard test method for laboratory measurements of airborne sound transmission loss of building partitions and elements. ASTM E90-09. West Conshohocken, PA: ASTM.
Standard classification for determination of impact insulation class. ASTM E989-06. West Conshohocken, PA: ASTM.
Standard test method for laboratory measurement of impact sound transmission through ceiling assemblies using the tapping machine. ASTM E492-09. West Conshohocken, PA: ASTM.
British Standards Institution (BSI) (1995) Acoustics. Measurement of sound insulation in buildings and of building elements – Part 3: Laboratory measurements of airborne sound insulation of building elements. BS EN ISO 140-3. London: BSI.
British Standards Institution (BSI) (1998) Acoustics. Measurement of sound insulation in buildings and of building elements – Part 4: Field measurements of airborne sound insulation between rooms. BS EN ISO 140-4. London: BSI.
British Standards Institution (BSI) (1998) Acoustics. Measurement of sound insulation in buildings and of building elements – Part 8: Laboratory measurements of the reduction of transmitted impact noise by floor coverings on a heavyweight standard floor. BS EN ISO 140-8. London: BSI.
British Standards Institution (BSI) (2006) Acoustics – Measurement of sound insulation in buildings and of building elements, Laboratory measurement of sound reduction index improvement by additional linings. BS EN ISO 140-16. London: BSI.
British Standards Institution (BSI) (1998) Acoustics. Measurement of sound insulation in building and building elements, Laboratory measurements of impact insulation of floors. BS EN ISO 140-6. London: BSI.
British Standards Institution (BSI) (1998) Acoustics. Measurement of sound insulation in buildings and of building elements, Field measurement of impact sound insulation of floors. BS EN ISO 140-4. London: BSI.
British Standards Institution (BSI) (1994) Acoustics. Measurement of sound insulation in buildings and of building elements, Laboratory measurement of room to room airborne sound insulation of a suspended ceiling with a plenum above it. BS EN 20140-9. London: BSI.
British Standards Institution (BSI) (1992) Acoustics. Measurement of sound insulation in buildings and of building elements, Laboratory measurement of airborne sound insulation of small building elements. BS EN 20140-10. London: BSI.
British Standards Institution (BSI) (1997) Acoustics, Rating of sound insulation in buildings and building elements, airborne sound insulation. BS EN ISO 717-1. London: BSI.
British Standards Institution (BSI) (1997) Acoustics, Rating of sound insulation in buildings and building elements, impact sound insulation. BS EN ISO 717-2. London: BSI.
British Standards Institution (BSI) (1997) Acoustics, Sound absorbers for use in buildings, rating of sound absorption. BS EN ISO 11654. London: BSI.
COST (2013) Towards a common framework in building acoustics throughout Europe. European Conference on Sound Insulation in Housing: Findings of COST Action TU0901, Copenhagen, December 3.