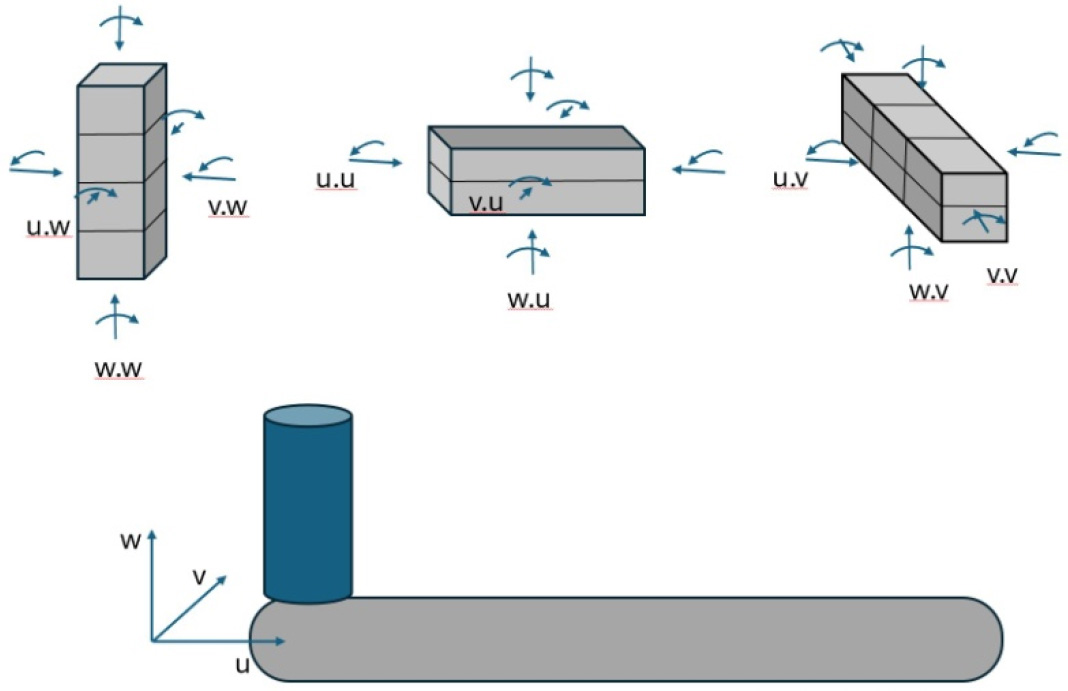
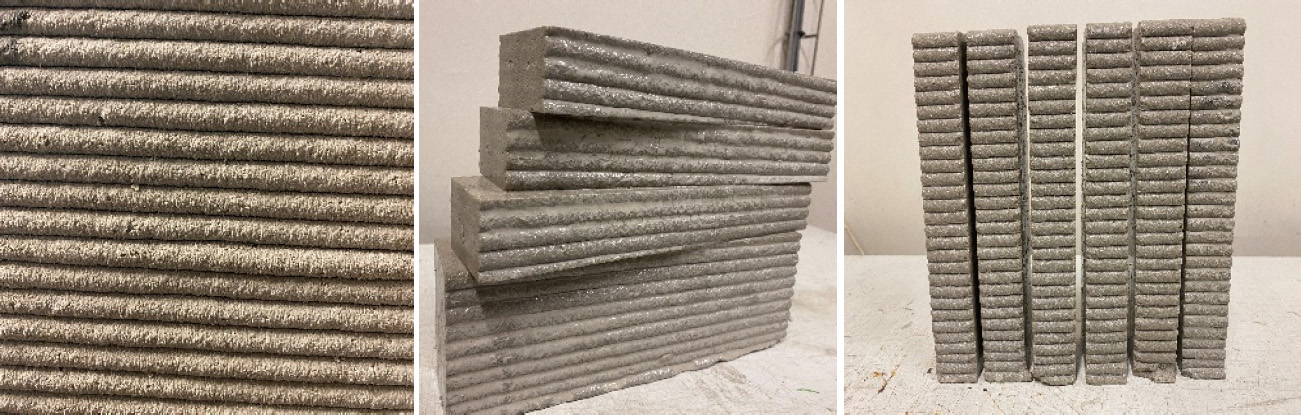
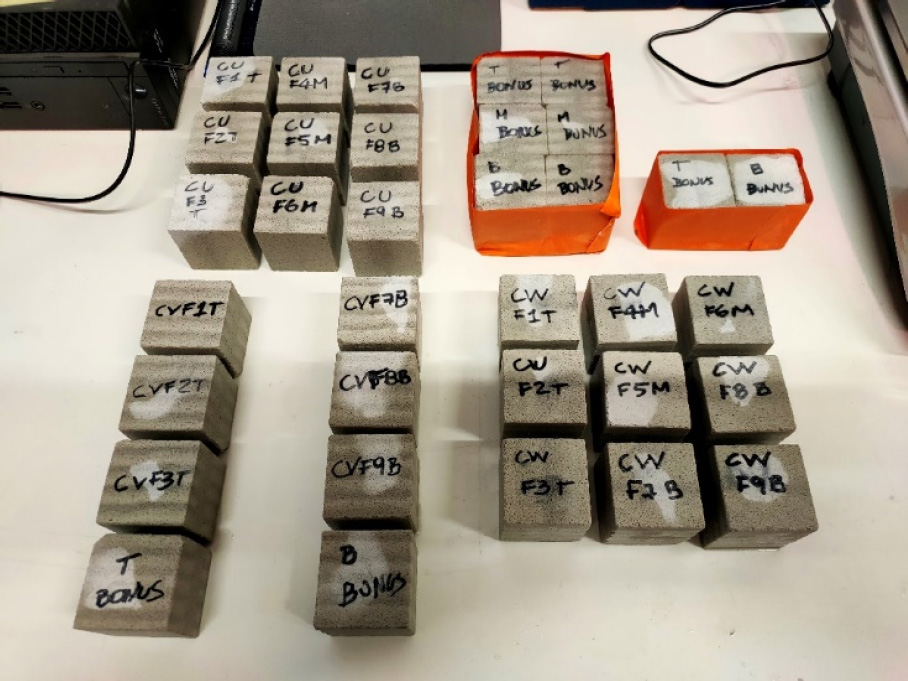
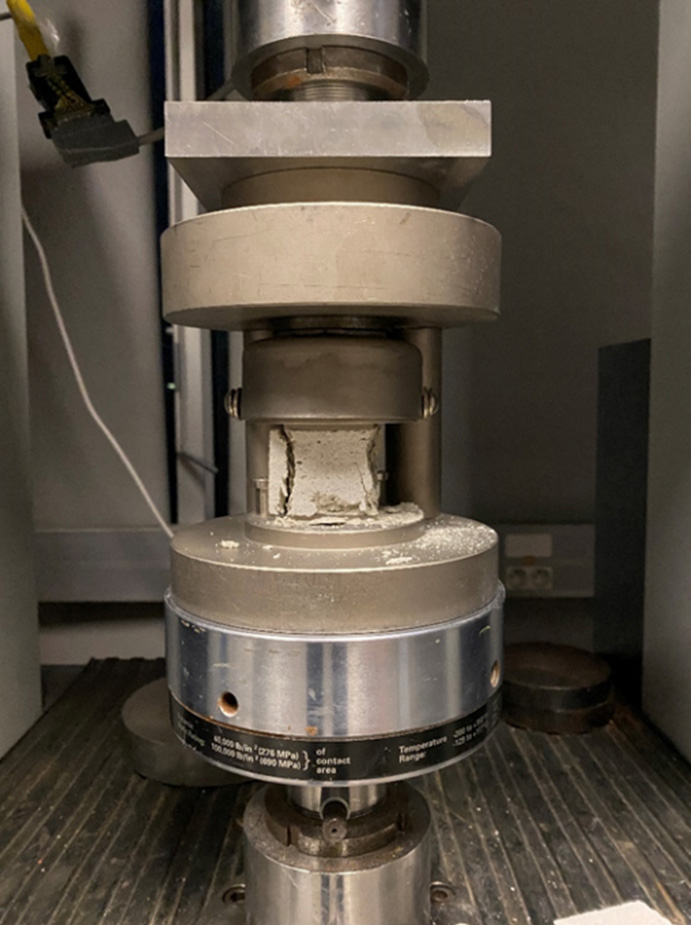
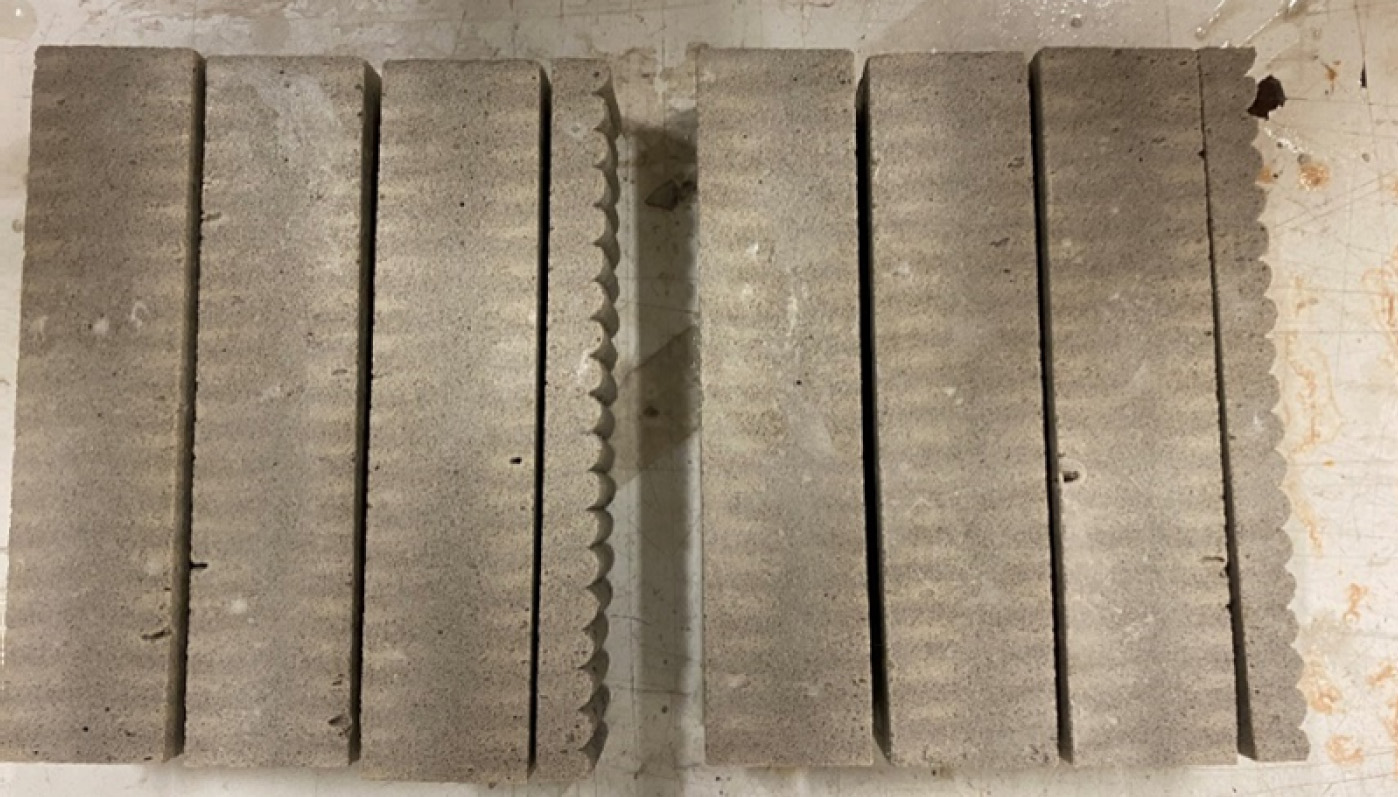
Nicolas DUCOULOMBIER1, Victor DE BONO1, Fatima Zahraa KACHKOUCH2, Yohan JACQUET3 and Arnaud PERROT2 1 XtreeE, Rungis, France 2 IRDL, Université de Bretagne Sud, Lorient, France 3 Technische Universität Berlin, Germany Compared with the cast concrete used in traditional construction methods, 3D concrete printing imposes new specifications in the fresh state (Roussel 2018; Nicolas et al. 2022) and induces a potentially more complex anisotropic mechanical behavior in the hardened state (Asprone et al. 2018; Mechtcherine et al. 2021, 2022; Bos et al. 2022). These new constraints require the implementation of a comprehensive characterization process throughout the lifecycle of the printed element and material. This process necessitates numerous tests at different phases of the printing project: The aim of this chapter is to provide an overview of the characterizations required in these three phases of a printing project. The formulation of a material for 3D printing involves rheological behavior characterization campaigns to ensure that the material meets all the specifications imposed by the various stages of the printing process. The mixture must be pumpable and possess a certain mechanical strength, characterized by a yield stress called flow and a rigidity characterized by an apparent elastic modulus high enough at an instant t to ensure the stability of the structure during printing (Perrot et al. 2016; Wolfs et al. 2018). To ensure the pumpability of mixes, the rheological behavior under steady-state conditions needs to be described by means of a rheometric test. As explained in Chapter 2, flowing cementitious materials exhibit viscoplastic behavior, which can be described by the Bingham, modified Bingham or Herschel–Bulkley models. Several flow geometries can be used to analyze the rheological behavior of cementitious materials: parallel-plate geometry or coaxial geometry (Figure 3.1). Parallel-plate geometry is often dedicated to cement paste, even though some planar rheometers allow concrete testing (necessary representative volume imposed by the size of the largest aggregate), whereas coaxial geometries are available at all scales (Feys et al. 2018; Perrot and Amziane 2024; Yahia and Perrot 2024). The test protocol must allow the material to be destructured to erase its history of stress and material structuring. Tests generally start with shearing at high speed, which destructures the material. Then, stepwise ramps of rotational speeds are imposed, and resistive torques are measured to scan a sufficient range of shear speeds. A number of data analysis methods can then be used to transform the rotational speed–torque data into flow curves, that is, the evolution of shear flow as a function of shear rate. For example, the Reiner–Riwlin method (Feys et al. 2013, 2023, p. 266; Wallevik et al. 2015) or the method developed by Estellé et al. (2008a, 2008b) appear in the literature as effective solutions for obtaining rheograms. Figure 3.1. Types of test geometry used to study the flow of cementitious materials: (a) parallel-plate; (b) coaxial geometry However, it is important to note that rheological flow behavior is not directly related to pumping behavior due to the phenomenon of particle migration under shear (Secrieru et al. 2020). In this case, it is often the behavior of the lubricating layer that dictates the pumping pressure (Secrieru et al. 2018; Tavangar et al. 2022). It is then possible to set up tests directly on the lubricating layer (cement paste and fine sand) or to encourage the creation of a lubricating layer during the test, as with the linear shear test generated by a slip test in an instrumented tube (Mechtcherine et al. 2014; Nerella and Mechtcherine 2018). The structural build-up of cementitious materials is often studied by measuring “static” shear yield stress after specific rest times. In this case, the age of the material and the aging conditions must be well controlled. Two time references can be used: the age of the material (after water–cement contact) and the resting time (after the sample has been placed in position for the test). For the study of structural build-up, the second time reference is used, which simulates the aging of the material after it has been deposited in layers (Perrot et al. 2016). Knowledge of the evolution of the static shear yield stress as a function of time enables stability conditions during printing to be verified. The shear yield stress is often measured using a rheometer equipped with a vane geometry (scissometer) that limits the effects of wall slip. The test is traditionally carried out at a constant shear rate, slow enough to render viscous effects negligible. However, the speed must not be too slow to prevent the material from structuring during the test. In this case, the shear yield stress is calculated from the maximum torque recorded, representative of shear failure of the material (Roussel 2005). This test induces progressive destructuring of the material (transient regime) until it begins to flow. An increasing stress ramp can also be applied to the material, and the shear yield stress in this case corresponds to the sudden acceleration in material deformation recorded during the test. Typical curves for these tests are shown in Figure 3.2. The cone penetration test is also often used to calculate the shear yield stress from the penetration of the material cone in the material at a given point in time (Lootens et al. 2009; Mazhoud et al. 2019). In this case, the shear yield stress is calculated by balancing the force of gravity acting on the cone and the shear forces generated on its surface. Figure 3.2. Shear yield stress measurements using Vane geometry: (a) constant speed test; (b) stress ramp It is interesting to note that versions of these tests which can be used continuously have been developed. A team at TU Dresden has set up a so-called “single batch” test, in which the same material sample is subjected to successive vane shear tests stopped at peak torque to limit material destructuring (Ivanova and Mechtcherine 2020). This method underestimates the rate of structural build-up by around 10%, but saves considerable time and reduces the dispersion of results caused by the variability of material samples. Similarly, slow-speed penetration tests have been developed to continuously monitor the evolution of the material’s shear yield stress (Pott and Stephan 2021; Reiter et al. 2022). During the printing process, cementitious materials are subjected to compressive stresses related to the support of the layers placed above them. For certain geometries of printed structures, the material may also be in tension (Jacquet et al. 2021a, 2021b). It is therefore interesting to study the material’s behavior in compression or tension to more accurately predict the material’s stability with regard to the loading of the base layer and the occurrence of cracks in the material’s zones, which are under tension. Regarding compressive behavior, uniaxial compression tests can be used to determine the material’s compressive yield point. This yield stress can be measured on materials of different ages in order to monitor the effect of structuring on compressive behavior. When carrying out this type of test, care must be taken to limit wall shear to ensure pure compression loading. It is also important to note that the specimen’s slenderness (ratio of height to diameter in the case of a cylindrical specimen) will play a role in the type of loading, and a slenderness of two will be more suitable than a slenderness of one for compressive loading. Finally, optimal specimen dimensions must also be chosen to limit the effects of gravity on the sample and to have a volume adapted to the dimensions of the largest particles. For tensile behavior, it is possible to test the material under its own weight at the exit of a print head (Jacquet et al. 2020; Ducoulombier et al. 2021), using the so-called “slug test”, or to use dumbbell geometries to generate tensile stress in the shrinkage zone. As with compression tests, it is possible to carry out these tests after different resting times to study the evolution of the cementitious material’s tensile strength (Jacquet et al. 2021b). Examples of the geometries used to study the material’s behavior in compression and tension are shown in Figure 3.3. Figure 3.3. Test geometries for studying the elongation behavior of materials: (a) simple compression test; (b) tensile test device Finally, it is interesting to note that capillary extrusion tests can be used to study both compressive behavior (elongation failure yield stress in the shaping zone) (Perrot et al. 2012; Varela et al. 2023) and tensile behavior via self-weight failure tests by measuring the mass of filaments (called “slugs” in the literature) at the die exit. The apparent elastic behavior of cementitious materials in the fresh state is a key parameter for the 3D printing process. Indeed, one of the two modes of failure of structures during printing is related to the elastic buckling of the structure. Printable cementitious materials exhibit significant deformations before material flow, which can be considered at first glance as elastic deformations. It is first possible to obtain information on the apparent elastic behavior of structures by analyzing simple compression tests. However, care must be taken to use a Hencky strain calculation to account for the large strains obtained in such a test (Jacquet et al. 2022). This methodology provides an apparent material stiffness that can be used pragmatically to ensure that the structure will not buckle during printing. This procedure can also be carried out sequentially to obtain the evolution of the material’s apparent elastic modulus over time. Some authors have suggested using the deformation of a cantilevered beam to estimate the material’s elastic modulus in its fresh state (Jacquet et al. 2020). However, this type of measurement is limited to materials that are sufficiently firm for the test to be possible. Finally, oscillatory rheometry enables a closer examination of the behavior of cementitious materials below the yield stress. Shear flow is often used in this context, and the relationship between the elastic modulus and the shear modulus is applied, assuming a value for the Poisson’s ratio. A sinusoidal strain amplitude is imposed on the material at a frequency often close to 1 Hz, and the resulting induced stress amplitude is measured by the rheometer. This method provides continuous access to the loss modulus G’’ (viscous part) and the storage modulus G’ (elastic part) (Yahia et al. 2023). These moduli are used to calculate the apparent shear modulus G* of the material, which is the ratio of shear stress to strain. During the various phases of concrete structure construction, a range of internal pathologies can be encountered. As these are generally undetectable when they first appear, they can adversely affect the quality of the structure. Hence, it has become essential to use non-destructive methods to monitor structures regularly, in depth, and in real time. These techniques also have the advantage of reducing costs and intervention times. In this context, several non-destructive investigation methods have been implemented since the 1960s and are certified by COFREND (Comité Français pour les Essais Non Destructifs). For 3D concrete printing, Acoustic Emission AE, a technique originating in the 1950s (Drouillard 1994), is undoubtedly the most widely used. The instrumentation and components of the AE apparatus must meet the conditions required by the standards (Fournier 2018). As a passive method, AE can be sensitive to any active process (e.g. stressed materials) and depends in particular on several material-specific factors: when a material is stressed, internal defects (micro-displacements) develop, releasing energy in the form of transient elastic waves. These waves, originating from the material itself, are detected by piezoelectric sensors active in a frequency range extending from 20 kHz to 1 MHz (ultrasonic domain). These sensors transform mechanical waves into electrical signals, which are amplified and read by an acquisition system (Mix 2005; Ohtsu and Grosse 2008), enabling a comprehensive assessment of the internal behavior of materials. Evaluation can be carried out by tracking events in real time, locating a source in 2D or 3D, based on propagation speed, and characterizing the type of source (mechanism produced) by distinguishing the shape of the emitted elastic waves. Standards have been developed to provide certain guidelines specific to the use of AE in concrete (RILEM Technical Committee (Masayasu Ohtsu) 2010; Shen et al. 2020) and to classify damage based on parameters extracted from waveforms, such as the classification of cracks into cracks resulting from tension or other mechanisms (Ohtsu 2006, p. 200; Ohno and Ohtsu 2010; Aggelis 2011). Broadband sensors are recommended for hardened concrete (resonant frequency sensors can also be used with frequencies above 60 kHz) (RILEM Technical Committee (Masayasu Ohtsu) 2010). The choice of frequency is crucial, as it is directly related to the wavelength in the material – the main characteristic of ultrasonic waves. One of the major advantages of AE is its sensitivity to very low-energy phenomena. The use of AE has therefore been extended to the study of several intrinsic phenomena occurring during concrete setting, which play a crucial role in concrete performance. However, it is important to note the high attenuation of fresh concrete, which is of the order of 2 dB/mm (Iliopoulos et al. 2016), varying according to the frequency used. This implies a signal attenuation of 20 dB for a propagation of 1 cm, which is significant. Drying shrinkage, a phenomenon occurring in relatively fresh concrete, has been studied by several authors (Shiotani et al. 2003; Bacharz et al. 2015). Shiotani et al. (2003) monitored the formation of microcracks due to drying shrinkage in concrete containing glass beads (replacing aggregates) using broadband sensors at 12–960 kHz. They noted the effect of aggregates on AE activities, showing their beneficial effect on shrinkage limitations. Certain AE parameters were used to determine when microcracks develop into macrocracks. McLaskey et al (2007) monitored the formation of microcracks due to drying shrinkage using 200–800 kHz frequency transducers at the surface and depth of the concrete. They established a correlation between the frequency of acoustic emissions and setting time, identifying and classifying shrinkage microcracks by AE. With the same objective of classifying and identifying types of shrinkage microcracks, Bacharz et al. (2015) studied the evolution of microcracks in cementitious paste, on the concrete surface, and at the paste-aggregate interface using 30–80 kHz frequency bandwidth transducers. They noted higher acoustic energy at the concrete surface, compared to other locations. Some authors have focused on the microstructural activity of concrete. Skal’s’kyi et al. (2004) linked acoustic emissions to the development of the crystalline structure, which was almost complete after around six hours, noting a parallel drop in acoustic activity. Van Den Abeele et al. (2009) tested two mortars with different W/C ratios and showed an increase in acoustic emissions for a lower W/C, explained by faster hydration. In particular, they asserted that AE activity begins after temperature peaks, a finding that was also highlighted in Chotard et al. (2001) and Assi et al. (2018). However, other studies (Iliopoulos et al. 2016; Dzaye et al. 2018, 2020) observed high AE activity just after mixing. Further investigation is needed to understand the effect of fresh mixing and the resonant frequency of the sensors used on AE activity to explain the origin of acoustic emissions in the fresh state more deeply. Chotard et al. (2001) linked acoustic parameters (amplitude and frequency) to hydrate formation, using 50–300 kHz wide-bandwidth sensors connected to waveguides. The effect of the W/C ratio observed by Lura et al. (2009) demonstrated the presence of air bubbles by AE, highlighting the phase when mechanical properties begin to develop. Dzaye et al. (2018) studied segregation mechanisms, showing the effect of the density and viscosity of the cementitious paste on the decrease in acoustic energy and propagation velocity. They also demonstrated the sensitivity of AE to the movement of aggregates simulated by falling glass beads. In the majority of the studies cited above, sensors are placed on waveguides or formwork molds. However, Thirumalaiselvi and Sasmal (2019) conducted their study by placing the sensors directly in contact with the material. This prevented wave propagation for the first two hours after mixing, due to the high attenuation of fresh concrete (Iliopoulos et al. 2016). Nevertheless, and based on the evolution of the acoustic signals, they classified four mechanisms developing in concrete: the formation of CSH, the evaporation of water from the pores, chemical shrinkage and the appearance of microcracks. Recently, starting in 2022, three studies (Liu et al. 2022; Skibicki et al. n.d.; Yue et al. 2022) have monitored and evaluated the behavior of concretes obtained by 3D printing compared with those cast by the conventional method (using formwork), in the hardened state under mechanical loading. Yue et al. (2022) studied the behavior of printed concretes subjected to splitting and three-point bending, using 35–100 kHz bandpass sensors. They recorded the peak frequencies of the AE, roughly indicating the onset of damage. Peak frequencies were lower for printed concrete than for cast concrete, and higher for tensile cracking modes than for shear cracking modes for both types of concrete. In particular, they integrated the acoustic parameters AF (average frequency) and RA (the ratio between wave propagation time and amplitude), collected during fracture, into an automatic learning algorithm. This allowed them to classify and distinguish between tensile and shear microcracking modes for each type of concrete. Following this calculation based on AE parameters (Yue et al. 2022), it was shown that the percentage of micro-shear cracks in printed concrete is higher than in formwork concrete. Liu et al. (2022) studied concrete reinforced with mesh placed as an internal core in the concrete. They printed five different lattice structures to evaluate the mechanical properties of concrete under three-point bending using AE and DIC (digital image correlation). A positive correlation was found between acoustic parameters, notably number of hits and energy, and the deformation process during the first three phases of concrete failure. The dominant frequency domain also provided information on internal damage. Low-frequency values (around 100 kHz) were caused by cracking of the hardened cementitious paste, and high-frequency values (around 480 kHz) were caused by fracture of the fine aggregate particles. It has been observed that the number of hits and the dominant frequency of lattice-reinforced concrete were lower than those of control concrete (Liu et al. 2022). In addition to the energy dissipated by a material during an active process, AE can be used in transmission–reception mode, where energy is generated by one sensor and received by another (resonance frequencies can exceed 1 MHz). Skibicki et al. (n.d.) examined the effect of different distributions (linear and pyramidal) and the number of layers in printed concrete, on the material’s mechanical and acoustic properties. Acoustic analysis showed that ultrasonic (US) velocities and resonant frequencies are similar for printed concrete and reference concrete (similar result for US velocities in Liu et al. (2021)). No effect of the number of layers on US velocity was observed. Nevertheless, the US velocity indicated that failure of multi-layer printed samples occurs in different directions, in contrast to reference samples where cracks propagate mainly in the middle of the material. The effect of the presence of fibers (Skibicki et al. n.d.) in printed pyramidal samples was also illustrated by AE, with the highest US velocities, thus inducing high mechanical strengths (a similar result was obtained for formwork concrete by Kouta et al. (2021)). Liu et al. (2021) conducted a study on the analysis of the anisotropy characteristics of printed concrete loaded in different directions using US propagation velocities. The results revealed a decrease in US velocities of 5.38% and 8.22% in the Y and Z directions, respectively, with loading applied in the longitudinal direction only. Results obtained by Sun et al. (2021) in the same context demonstrated that the US velocity was higher for printed samples compared to reference samples. According to the authors, this is due to a more compact microstructure and lower porosity; printed paste achieves a higher degree of final hydration, explaining the US speed result which is directly associated with high compressive strength. Ma et al. (2020) evaluated the mechanical properties of printed mortar during the initial curing phases. They obtained a result similar to the previous study, showing that printed elements reach an age of 3–7 days with a stiffness 35% higher than that of reference samples. In conclusion, acoustic emission has been further developed for monitoring damage in hardened concrete. The application of this technique to the assessment of concrete in the fresh state has seen significant growth, highlighting the complex process of hydration. Nevertheless, the explanation of the sources of acoustic emissions is not yet fully understood. It depends on the conditions and assumptions made by the researchers during the experiments. It is therefore suggested that future research vary and record several input data (resonance frequency and sensor positions, concrete formulation and mixing process, environmental conditions). Note that in fresh concrete, in its liquid state, only longitudinal modes (where the particles in the medium vibrate parallel to the direction of propagation) propagate. Later, as the shear modulus increases (where the particles in the medium move perpendicular to the direction of propagation), shear modes and surface (Rayleigh) waves also develop. It would therefore be interesting to place AE sensors in contact with fresh concrete, so as to easily separate the different waves propagating in it. It should be noted, however, that direct contact results in strong attenuation of the waves (Iliopoulos et al. 2016), which suggests that the resonant frequency of the sensors should be chosen carefully. As far as the application of AE for 3D printing of cementitious materials is concerned, there are very few studies on this subject, spanning the period from 2020 to 2023. This research is a preliminary step toward future work to develop the basic acoustic parameters of printed structures and to deepen the analysis of crack location during loading, taking into account the anisotropy of printed concretes. It is also recommended to extend the analysis to the evaluation of mechanisms evolving during the setting of the printed material, particularly the development of microcracks at the interlayer of the material. While it is relatively easy to print a single part, it is quite another challenge to maintain a certain level of quality eight hours a day, five days a week, all year round. The slightest variability in the composition of raw materials can disturb the process, sometimes leading to quality defects during printing. These disruptions can be explained by two factors: variability in the materials used and variability in the printing system and processes. Material variability can itself be explained by variations in the natural composition of raw materials, or slight variations in their manufacturing and conversion processes. It is the latter that we will be focusing on in this section. The challenge for the manufacturer is to detect these variabilities, so as to be able to compensate for their effect on final quality by adjusting formulation and/or printing parameters. This constitutes the process quality assurance plan. A quality assessment can be used to ensure that the product is within the conforming value ranges, while quality control implies a notion of eventual correction of the properties of interest in order to guarantee that their values remain within the conforming value ranges. 3D printing processes, which include a large number of sensors and actuators enabling the process to be adjusted, have a significant capacity for correcting variations in the properties of interest, compared to traditional processing methods. The question is how to modify the process parameters slightly so that the natural variabilities of the material are compensated for, thus achieving continuity of quality. Detecting these variabilities, and the modifications they entail involves a number of steps grouped together in a global industrial quality protocol. However, the possibilities for in-process quality control differ according to the type of extrusion printing process used (see Table 3.1). Table 3.1. Ability to perform active quality control depending on the type of system used The use of batch mixing means that the formula can be adjusted as the cementitious material is produced. On the other hand, the multi-component nature of the process means that the rheology of the material and its evolution can be adjusted in-line to suit the geometry to be printed. However, this increased process control implies a greater number of parameters, de facto increasing the number of control procedures to be carried out by the manufacturer. In contrast, in the case of single-component, continuously mixed printing, all control and correction procedures are the responsibility of the material manufacturer. Controlling ingredients on receipt is a vital step. In the case of printable mortars, the ingredients received by the manufacturer depend on the type of process used (see Table 3.2). Controls focus primarily on solid components: cement, secondary binders and the granular skeleton in general, since these are natural components. Additives, on the other hand, are synthetic products, and their consistency is rarely called into question. Table 3.2. Raw material whose variability can be controlled Two main types of control must be considered to obtain sufficient characterization: control of binder reactivity and control of mix compactness, which drive the bulk of the material’s properties in the fresh state. However, these properties are difficult to measure directly. In practice, simple rheology tests developed for the quality control of cementitious materials (mortar, grout and concrete) are carried out on reference formulas, that is, with fixed quantities of each component. The main property to be characterized is the initial shear yield stress and its temporal evolution before and after the addition of liquid admixtures in the case of multi-component technology. For this purpose, the most commonly used tests are the cone spread test (ASTM Cone) or penetration structuring tests or Vane rheometry (Nicolas et al. 2022). However, knowledge of this property alone provides only partial information on the mix’s reactivity and compactness. An additional measurement would be necessary to obtain sufficient characterization (compactness and reactivity). In this case, a water demand test (Sedran 1999) can be considered, which is relatively heavy, but gives direct access to the compactness of the mix. Alternatively, measuring viscosity using a Marsh cone test (Roussel 2005), whose dependence on compactness differs from that of the shear yield stress, would make it possible to decouple the estimation of compactness and reactivity and obtain sufficient characterization for quality control of printable materials. Again, depending on the type of process, the number and possibilities of rheology control differ. Initial rheology can be measured at the mixing outlet in the case of continuous mixing, or even during mixing in the case of batch mixing. Control can be carried out using the same tests as those used for suitability, or with the aid of sensors included in the printing system. As far as pumping is concerned, there is currently no reliable universal indicator of the pumpability of a cementitious material. However, pumping is monitored using pressure transducers to track potential anomalies. Accurate in-line measurement of flow using sensors is often relatively complex to achieve. As a result, most large-scale 3D printing technologies use progressive cavity pump technology, enabling smooth dosimetric pumping. However, the efficiency of these pumps depends on the rheology of the material. It is therefore customary to calibrate the flow rate at the start of printing. When using a variable print flow rate, it may also be important to check the linearity of the flow rate with pump rotation, which may not be achieved due to the rheo-thickening nature of mortars at high shear rates (potentially achieved at high flow rates). This calibration procedure can be carried out by simple sampling, or automatically if the system is fitted with a flow sensor. Once pumping has started, it is necessary to adjust the consistency of the extruded material before printing begins, and then to check the quality of the extrusion and ensure that it can print a given design. To do this, it is necessary to measure the consistency of the material leaving the extruder and its structuring. Once again, this involves measuring a shear yield stress and its evolution immediately after extrusion. However, extruder exit measurements are challenging since printable materials inevitably undergo rapid changes in shear yield stress over time, making this a very active field of research. Most often, manufacturers, especially those using single-component technologies, aim to check that the consistency of the mortar and its evolution is repeatable and greater than the minimum value expected for a given material. In the case of multi-component technologies, it is possible to adjust these values by adding the accelerator to target the structural build-up rate required for a particular design. The initial consistency of the material is vital to the quality of the deposit. A yield stress that is too high will lead to a rough surface appearance and cracks, while a yield stress that is too low will cause the deposited strand to crush under its own weight. This often results in the progressive removal, layer after layer, of the robot from the previous layer, leading to the ruin of the structure. Due to the rapid evolution of this parameter at the nozzle outlet, it is not easy to measure it using the classic rheological tests discussed above. Instead, we use the slug test (Ducoulombier et al. 2021), which relies on the fact that increasing the value of the shear yield stress implies a transition from laminar flow to a drop-by-drop, slug-to-slug flow, the length of which varies proportionally with the shear yield stress. This particular property enables easy adjustment of water dosage – the main and often only parameter in continuous mixers – or of the quantity of accelerator in the event that the initial yield stress value of the initial mortar is too low. Strictly speaking, is the structural build up affecting the evolution of all mechanical properties (in tension-shear and compression) over time? However, it is often aggregated into the evolution of the shear yield stress alone, which is relatively easy to measure. For this, the simplest method is to perform a scissometer test (hand vane test or low constant shear test) discussed in section 3.2.1.2. This test typically evaluates shear yield stresses ranging from 1 to 100 kPa (Khayat et al. 2012). Structuring is then obtained by interpolating several measurements at different rest times. This test is relatively straightforward, since it can be carried out by hand using the method presented in the previous section, after sampling the mortar at the extrusion outlet into prismatic containers. A special pocket vane geometry is also very interesting, as it enables the test to be carried out directly in situ on printed extruders (Demont et al. 2023). Another method for assessing structure is to perform penetrometric tests, which have the advantage of being easy to automate. The various methods were presented in the previous section. However, the latter method needs to be calibrated in order to obtain a robust quantitative measurement of the shear yield stress. For certain protocols, it does, in fact, make it possible to obtain a continuous measurement of the evolution of the shear yield stress over time. However, this measurement of aggregate structuring by shear yield stress has limitations for geometries involving complex mechanical loads, combining tensile, compressive and shear forces. Given the difficulty of fully characterizing the evolution of the strength domain over time, benchmark geometries have been developed to provide representative combinations of stresses, and to ensure that the material functions normally. The results of these comparative studies also provide an idea of the stability obtained with a given material. This property is not directly linked to changes in the material’s strength but to its elasticity. The stiffer the material, the more stable the printed part. However, the stiffness of printed materials is very difficult to measure, as it requires deformation measurements that are hard to achieve by construction manufacturers. Benchmark geometry stability is therefore a relatively simple method, providing an indirect assessment of material stiffness and its temporal evolution. The 3D concrete printing process essentially requires no formwork to guarantee geometric conformity. On the other hand, the printed material is directly exposed to variations in humidity, temperature and air flow. When the material is young, it is likely to be subject to heavy drying, particularly in dry weather. This evaporation of water from the surface of the printed material layer can have repercussions not only on cement hydration, but also on water distribution in the core of the printed material. A number of technical solutions exist to reduce the influence of these physical phenomena on the final durability of printed cementitious materials. Three major types of shrinkage are commonly distinguished in 3D printing: endogenous shrinkage, plastic shrinkage and drying shrinkage: In the case of 3D-printed concrete elements, only the final two points differ from a cast-in-place element. Drying shrinkage is conditioned by the porosity of the concrete, the humidity of the ambient air and the ratio between the exposed surface and the volume of the element. For 3D-printed structures, the multi-layer nature of the material means that the exposed surface area is considerable. What is more, the use of VMAs (viscosity modifying agents) often induces high porosity in materials during curing. Despite the significant contribution of drying shrinkage, plastic shrinkage remains predominant, as it is mainly related to the rheological properties of the printed material. This loss of water in the fresh state is induced by surface evaporation, which can be accentuated by the difference in ambient humidity. This plastic shrinkage can also be followed by a delayed migration of water from the core of the material to areas with lower water content, those having previously undergone drying by surface evaporation. This induces a pressure gradient dominated by capillary pressure, causing water to migrate from the center of the printed material layer toward the surface exposed to air, with the aim of returning to a state of equilibrium (Keita et al. 2019). This water migration is also determined by the rheological properties of the printed materials, in particular, the permeability of the material and the viscosity of the interstitial fluid. Optimizing the compactness of the granular skeleton and adding viscosity-modifying agents helps to reduce this permeability and the associated plastic shrinkage. The addition of cellulose ethers has now become commonplace in the formulation of printable cementitious materials, as it not only achieves the rheological properties required for extrusion, but also significantly reduces surface drying (Brumaud et al. 2013). In addition to the surface effects (cracking, crazing, dimensional variations, etc.) caused by evaporation, the lack of hydration can negatively affect the cement’s hydration, thereby impacting the final strength of printed structures. There are four main ways of curing printed materials: Considering the direct environment (temperature, ambient hygrometry, air flow, etc.) may eventually involve co-simulation of the additive manufacturing process during component design, so as to ensure that the required mechanical performance can be achieved. This co-simulation will consider aspects related to rheological properties in the fresh state (water migration/evaporation kinetics), properties during hydration (shrinkage and plastic deformation) and the prediction of the structure’s service-life mechanical properties. Homogeneity during printing can be checked by analyzing data collected during printing. For example, droplet mass dispersions collected before printing can be used to judge material consistency during printing (Ducoulombier et al. 2021). Similarly, it is possible to use direct visual inspection or via an on-board camera to analyze defects during deposition and ensure that material extrusion remains constant during the process. The quality of the bead (geometry and surface appearance) is often a very good approximation of its homogeneity, as material heterogeneities generally result in inhomogeneous flows. Finally, the many sensors integrated into the systems, such as pressure transducers and motor torque measurement, enable us to obtain stable curves over time during printing, highlighting the stability and homogeneity of the material’s behavior during the manufacturing process. As in the precast concrete industry, controlling the aging conditions of the material is crucial. Limiting drying and controlling curing speed can be achieved in a precast-type industrial printing context to ensure optimum curing of the cementitious material. Concrete curing is a major element often used in prefabrication plants, particularly those using ultra-high-performance cementitious materials. For example, it can enhance mechanical performance and limit shrinkage and creep. The latter is more complex to apply when printing on site. Due to the need to control the evolution of consistency and setting, quality protocol is naturally more important for additive manufacturing processes and is often an argument for the higher cost of this type of material. However, from our point of view, this increased control is an opportunity, particularly in the case of two-component batch printing processes. This is because the knowledge acquired about the material during preliminary trials or during the manufacturing process not only reveals any potential anomalies, but also enables the formula to be adjusted for optimum use of the material. There is even reason to believe that this could enable the use of materials whose cement content could be reduced in comparison with cementitious materials used in traditional processes, where excess cement provides the robustness required for their use in a context of low control. In the case of printable materials, a significant part of the robustness could be provided by the industrial process and quality control. Controlling curing is also an essential element in guaranteeing the quality and optimum performance of the cementitious material used. When 3D printing in an industrial context, many parameters need to be controlled: it may be worthwhile to set up a database and analyze it to build a predictive tool for print quality and the influence of process parameters on the properties of interest. These data can also be used to build digital twins of the parts, including all the manufacturing data for the elements at each point of the printed part. In practice, the specifications for printed materials are quite similar to those for cast cementitious materials. Depending on the mechanical loads applied to them, their mechanical properties must be characterized in one or more directions corresponding to the loading. Their durability also needs to be justified, generally by carrying out freeze–thaw cycle tests and measuring their porosity and permeability. However, further checks are often required to control the effect of printing parameters on the property of interest (mechanical, hydric and thermal). Process parameters are therefore of prime importance, and the aim is to characterize specimens whose printing parameters are representative of those used in the manufacture of the printed element. When 3D printing cementitious materials, it may be necessary to determine the physical properties of the printed materials. For example, the bulk density of printed materials can be monitored to assess the homogeneity of the printed material. This involves isolating part of the material (sampling), estimating the volume and weighing the material. Volume measurement can be complex on mortar or printed concrete beads, due to their potentially complex cross-sectional shape and lateral beading. Volume measurement by hydrostatic weighing requires the material to be sufficiently hardened, but can be carried out if the sample is protected from evaporation. The 3D scanner can be an interesting and rapid technique for accurately estimating sample volume. Observation of the material’s microstructure using fine imaging techniques such as scanning electron microscopy or micro-tomography is extremely interesting, as it can provide information on the organization of porosities within the material. However, it is very difficult to organize in an industrial or quality control context. This section is based on the test protocols drawn up by the RILEM 304-ADC Technical Committee: Assessment of Additively Manufactured Concrete Materials and Structures in 2022. This was part of an international campaign in which over 20 laboratories and companies took part in the mechanical characterization of various materials printed in the cured state. These inter-laboratory and inter-company tests made it possible to evaluate different systems and materials, as well as the impact of 3D printing processes on mechanical strengths, particularly depending on the printing direction. Indeed, the superimposition of printing beads induces geometric anisotropy (the material does not necessarily have the same mechanical properties depending on the loading direction). Mechanical characterization of printed materials therefore requires specimens to be tested in different loading directions (Figure 3.4). Figure 3.4. Example of three different loading directions for prismatic flexural specimens. The loading face is shown in blue Due to the wide variety of printing systems used, these tests are divided into two sub-categories, one at mortar scale and the other at concrete scale. These two scales are used here to specify the size of the specimens tested. Indeed, some printing systems are capable of printing thin beads, while others are suitable for printing thicker beads. In addition, the use of 3D concrete printing varies according to requirements, whether for thin walls or volume fills. Depending on the printing system used, the printed objects will have different dimensions, as will the specimens to be mechanically tested. The remainder of this section will therefore distinguish between mortar scale and concrete scale. The specimens detailed in the following subsections were all taken from a printed geometry. After printing, the object is protected from the outside air by being covered with a tarpaulin, then cured for the time specified for each test, generally 28 days. The day before testing, the pre-printed part is cut into several test pieces (see following sections) for mechanical testing. To ensure that the characterized material is printable, the printed object from which the test specimens are taken must have a minimum height of 25 cm for the mortar scale and 50 cm for the concrete scale. The aim of this study is to characterize the material, not the geometry. Thus, the “beads” formed by the juxtaposed strings will be cut and removed from the test specimens (see following sections). To ensure that future test specimens can be extracted from the printed geometry, different paths are proposed depending on the width of the bead. In this international study involving various research laboratories and companies, each participant was asked to compare printed specimens with specimens cast in place in molds, from the same material used for printing. As an option, each participant could also evaluate the impact of the cure. For the mortar scale, the specimens tested are 40 × 40 × 40 mm cubes, with a tolerance of ±1.0 mm. In this study, these cubes were not derived from previous bending tests (EN-196-1). The cubes are therefore extracted by cutting the printed part (Figures 3.5 and 3.6). The three possible bead orientations are tested, and each is called a series. These three series are broken down into three locations, depending on where the cube was extracted from: bottom, middle and top. As each test has to be repeated three times, there are a minimum of nine specimens per series, making a total of 27 cubic specimens. For the concrete scale, the test specimens are 150 × 150 × 150 mm cubes, with a tolerance of 3.75 mm. All three spatial directions are also tested. As each test has to be repeated five times, this makes a total of 15 cubic test specimens for the concrete scale. The tests in this study (Figure 3.7) are recommended to be carried out on stress-controlled presses. After each specimen has been weighed and measured, it is tested in compression to failure, at a slow, constant loading rate (2,400 N/s for mortar, 0.6 MPa/s for concrete). Figure 3.5. Example of specimen preparation in the Navier laboratory. Left: a portion of a printed element. Center: preparation of horizontal cut-outs. Right: preparation of vertical cut-outs These tests are used to determine the material’s characteristic modulus of compressive strength in all three directions. Figure 3.6. Example of cubic specimens from a printed object (Navier laboratory). Here, the bead lines remain visible even after cutting, depending on the mortar and system used Figure 3.7. Compression test completed on cubic specimen for mortar scale Three- and four-point bending tests are recommended. For the mortar scale, the specimens tested are rectangular prisms measuring 40 × 40 × 160 mm, with a tolerance of ±1.0 mm. All three possible bead orientations are tested. Each orientation test is repeated five times, for a total of 15 specimens. For the concrete scale, the test specimens are rectangular prisms measuring 100 × 100 × 400 mm, with a tolerance of ±3.0 mm (Figure 3.8). All three possible bead orientations are tested. Each orientation test is repeated five times, for a total of 15 specimens. The tests in this study are designed to be carried out on stress-controlled presses. After each specimen has been weighed and measured, it is tested in three-point (Figure 3.9) and four-point (Figure 3.10) bending to fracture, with a length between supports of 100 mm for the mortar scale and 300 mm for the concrete scale. These tests are used to determine the characteristic flexural strength modulus in all three directions and to calculate a tensile strength modulus. Figure 3.8. Cutting prismatic specimens from a printed piece. Here, the traces of the bead are visible, depending on the mortar/concrete and the system used Figure 3.9. Three-point bending tests at the Navier laboratory Figure 3.10. Completed four-point bending tests at the Navier laboratory For direct tensile tests, the specimens are of the same type and size as the prismatic specimens used for bending tests (see section 1.3.3.2). The tests in this study are designed to be carried out on universal testing machines which can be controlled in terms of displacement. After each specimen has been weighed and measured, it is tested in tension. These tests are used to determine the characteristic tensile modulus. To characterize the impact of the 3D printing process on a given material, the test protocol developed by RILEM has made it possible to compare results from numerous laboratories and companies around the world. The principle is to study the impact of superimposed beads in all three spatial directions, mainly by testing cubic specimens or rectangular prisms. However, this test protocol is more varied than summarized in this section. The durability of printed concrete structures is closely linked to the properties of the materials in their fresh state and to the printing process. These parameters include, but are not limited to, construction time, extrusion potential and the rheological properties of the deposited materials. The strong interaction between process and material is directly correlated to the final durability of the printed structures. The 3D concrete printing process is a complex additive manufacturing process which, at each stage, has a number of issues whose consequences can be observed in both the fresh and hardened states. There are three critical points of interdependence in the process itself: Matching the rheological properties of the fresh material to the entire automation chain is the main determinant of the final quality and durability of the printed concrete structure. Also, in the context of the 3D extrusion deposition printing process, there can sometimes be relatively long pauses, or a long trajectory length per layer, which means that the time elapsed between layer n and layer n+1 results in the surface drying detrimental to the adhesion of said layer n+1 (Feng et al. 2015). It is therefore important to ensure that printing parameters are chosen to limit undesirable drying. It should be noted that environmental control is also an important element in reducing surface evaporation. Print cycle times depend on the printed geometry and the parameters of the printing process (speed, sequence, etc.). It is essential to optimize the impact of these cycle times on the manufacturing process and to take them into account in the design process for structural components. The problem of drying at the interface, and the resulting mechanical weaknesses, is mainly due to the creation of cold joints between layers when the cycle time is too long (Panda et al. 2018). However, it has been shown that sand particle size also affects adhesion between printed layers (Zareiyan and Khoshnevis 2017). Cold joints can be temporary as the bond strength between layers increases with the creation of cement hydrates during setting. A number of studies have highlighted the value of adding an interlayer bonding agent to promote interlayer bonding. The bonding agent can be a resin (Weng et al. 2021), or even simpler, the addition of a cement paste (Marchment et al. 2019). It should also be noted that interface properties are also dependent on the type of extrusion. Infinite brick extrusion imposing zero flow at the nose outlet creates a wall effect that leads to a necessary reduction in the concentration of larger aggregates at the interface. Conversely, pressure-directed processing imposes a free-surface flow after the extruder outlet, which cancels out the wall effect imposed by the extrusion nozzle (Buswell 2020). In any event, it will be necessary to carry out the same durability tests as for conventional cast concrete structures, while also taking into account the specific features of printed concrete (anisotropy, presence of an interlayer), the quality of which is critical for preserving the integrity of the printed structure. Tests of resistance to chemical agents (Baz et al. 2021; Zhang et al. 2021), to chloride ion penetration (Van Der Putten et al. 2020; Malan et al. 2021; Bran-Anleu et al. 2023; Surehali et al. 2023) and to carbonation must also be carried out for printed concretes, ensuring that the printing parameters used are representative of those used in the manufacture of the structures in question. Resistance to accidental actions such as fire or earthquakes is also a topic that requires further investigation and development (Suntharalingam et al. 2021; Delavar et al. 2023). As this chapter has demonstrated, the development of 3D concrete printing is accompanied by the adaptation and creation of new tests used both in the formulation phase of a printable material to understand its material behavior as well as to implement quality control in the laboratory and throughout the value chain. However, this increased quality is an opportunity to make the best use of the material used. What is more, the 3D printing process makes it possible to aggregate a large amount of data during processing. This could in future reduce the processing uncertainty that today justifies the high safety coefficients applied during traditional processing. Many of the advances presented in this chapter have been achieved and will serve as the basis for future standards governing the 3D concrete printing process. These will ensure that the material exhibits rheological behavior appropriate to the printing process, as well as guaranteeing the service-life behavior and durability of the printed structure.
3
From Laboratory to Practice: Characterizing Fresh and Cured Printed Materials
3.1. Introduction
3.2. Characterization of fresh materials
3.2.1. Laboratory formulation – specifications
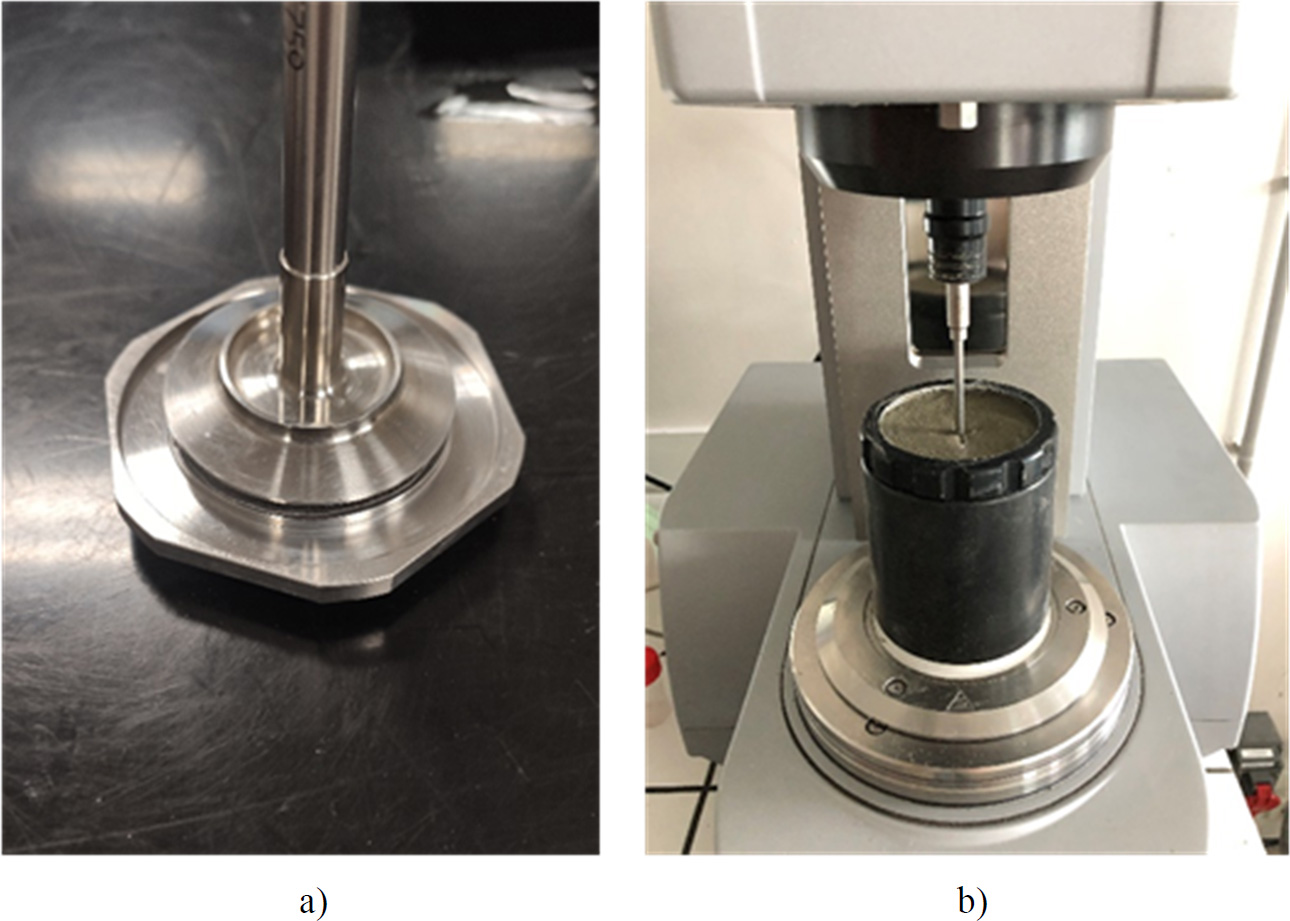
3.2.1.1. Rheological behavior under steady-state conditions
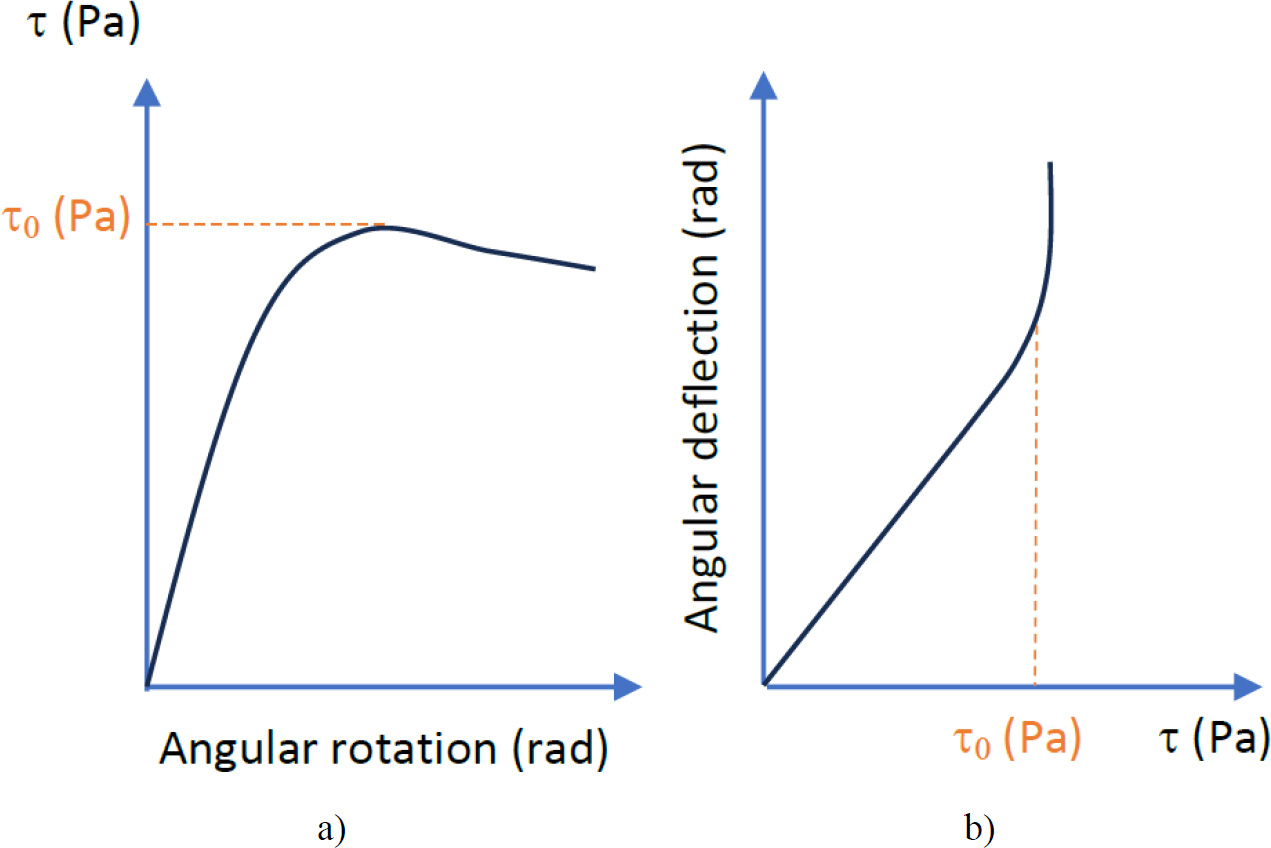
3.2.1.2. Structural build-up of cementitious materials
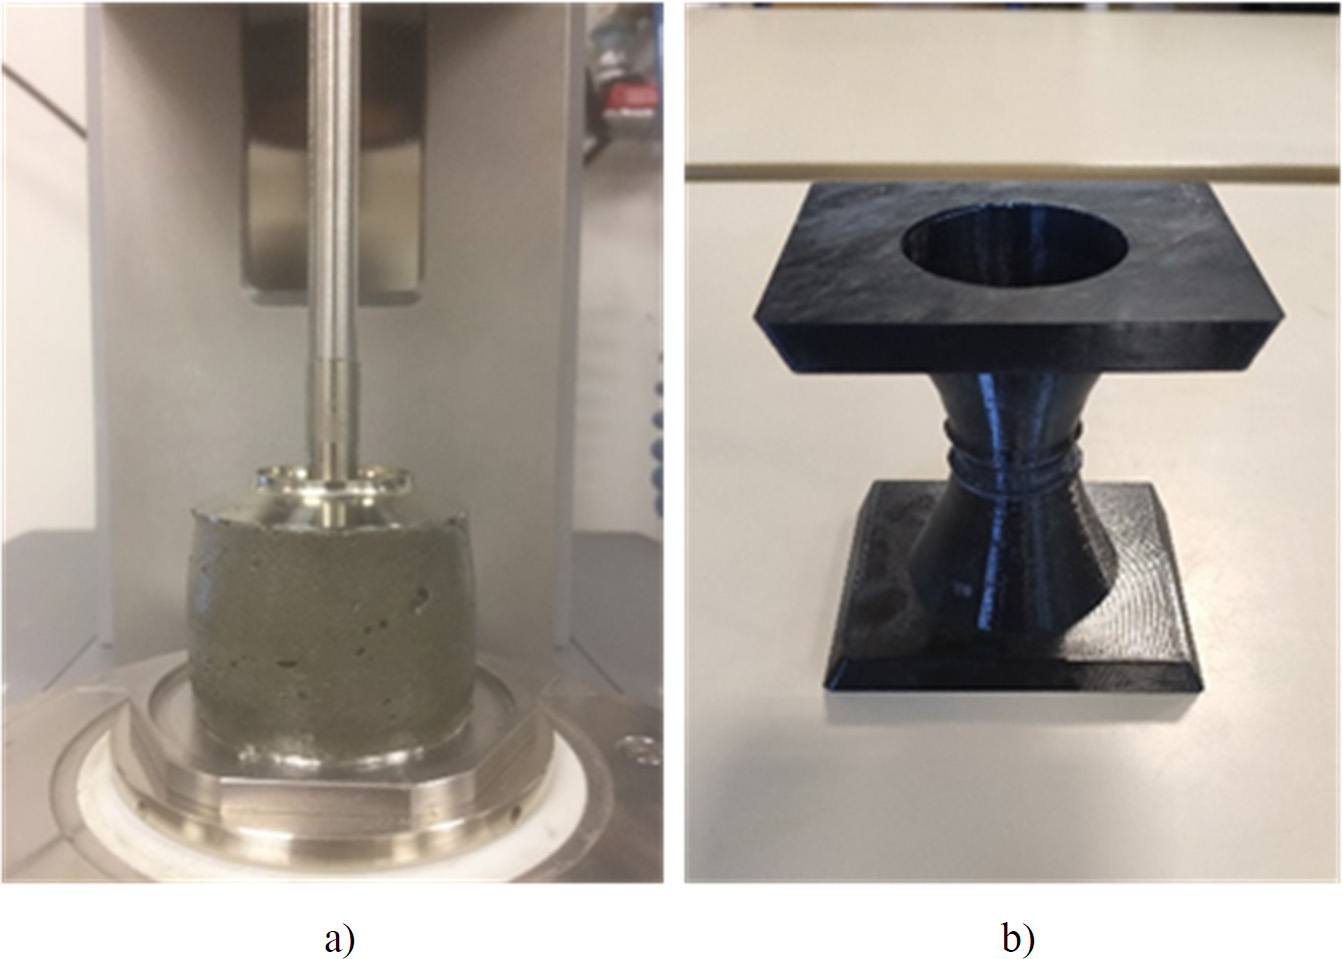
3.2.1.3. Elongation behavior of materials
3.2.1.4. Apparent elastic behavior
3.2.1.5. Non-destructive testing
3.2.2. Print control in an industrial context
Continuous
Discontinuous/batch
Single-component
Very poor control
Poor control
Multi-component
Medium control
High contron
3.2.2.1. Controlling ingredients on receipt
Continuous
Discontinuous/batch
Single-component
Premix
Premix or solid components (binders, fillers, sands, aggregates), liquid admixtures, solid admixtures
Multi-component
Premix, liquid admixtures
Premix or solid components (binders, fillers, sands, aggregates), liquid admixtures, solid admixtures
3.2.2.2. Initial rheology and pumping control
3.2.2.3. Control of material stiffening and printing stability
Measuring initial consistency
Measuring structuring
3.2.2.4. Shrinkage control of printed samples
3.2.2.5. Homogeneity control of printed materials
3.2.2.6. Printing conditions and ageing of the printed structure
3.2.2.7. Summary
3.3. Characterization of hardened materials
3.3.1. Specifications
3.3.2. Characterization of physical properties
3.3.3. Mechanical characterization of printed materials
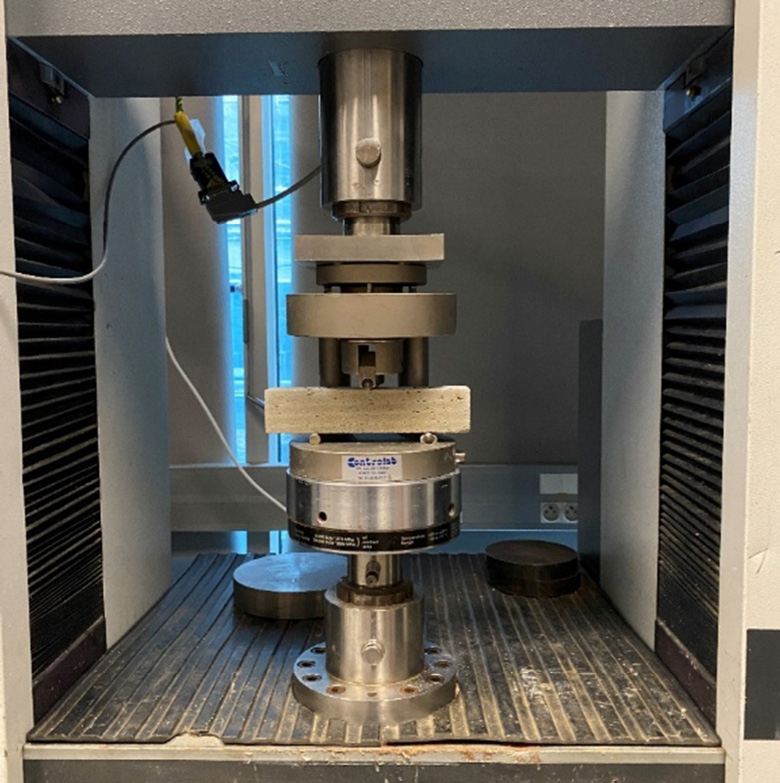
3.3.3.1. Compressive strength
3.3.3.2. Flexural and tensile strength
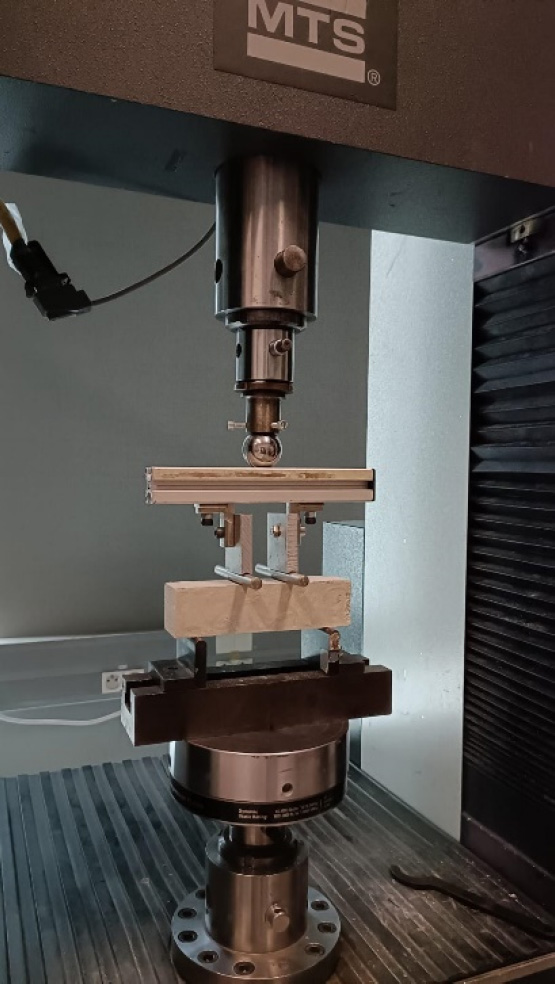
3.3.3.3. Tensile strength and interlayer qualification
3.4. Durability
3.5. Conclusion
3.6. References
Notes