Orienting a house to the south or slightly east of south opens south windows to accept solar gain in the winter when the sun is low in the southern sky (Figure 13.1). A southern orientation also helps to exclude solar gain in the summer when the sun is high in the southern sky. An understanding of where the sun is in the sky and how to construct shading devices to allow winter sun to penetrate while excluding summer sun is central to passive solar design.
To properly design solar shading devices it is necessary to understand solar diagrams and how to plot the performance of shading devices in diagrams. The path of the sun across the sky dome can be projected onto a horizontal surface (Figure 13.2). The horizon is represented by the circumference of the circular diagram. The concentric rings represent 10 degree increases in altitude, from 0 degrees at the horizon on the outer ring of the diagram, to 90 degrees at the center of the diagram. These angles are referred to as altitude angles. The lines that form spokes on the diagram count out 10 degree increments along the ground plane. These angles are referred to as azimuth angles. The path of the Sun is plotted on top of this polar diagram by month and time of day. The time markings on the chart are solar time not standard or daylight savings times. Solar time is defined by positioning noon at the point where the Sun is halfway across the sky. As an example of how to read the time lines look at December on the 40 degree north latitude Sun chart. The Sun rises 59 degrees east of south at about 7:30am, at noon the Sun is due south and at an altitude angle of 27 degrees, and the Sun sets 59 degrees west of south at about 4:30pm.
The parts of the sky that shading devices cover up can be plotted on the sun path diagram (Figure 13.3). The area of the sky that is covered by a shading device represents the times of the year when the Sun does not strike the window because the shading device is blocking the sun. The Sun path diagram represents the view of the sky that the entire window sees. To get a feeling for this idea consider your eyes to be a window. If you put your hand above your eyes you cannot see the part of the sky your hand blocks out. Whenever the sun is in that part of the sky your eyes, or the window, will be in shade. If you hold your hands up on either side of your eyes there will be parts of the sky on either side of you that you cannot see.
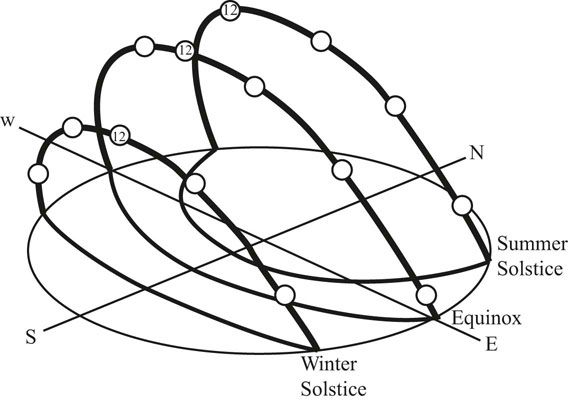
FIGURE 13.1 Creating a flat map of the position of the Sun in the sky vault.
Source: Olgyay, Victor. Design With Climate. Copyright 1963: Princeton University Press. 1991 renewed PUP. Reprinted by permission of Princeton University Press.
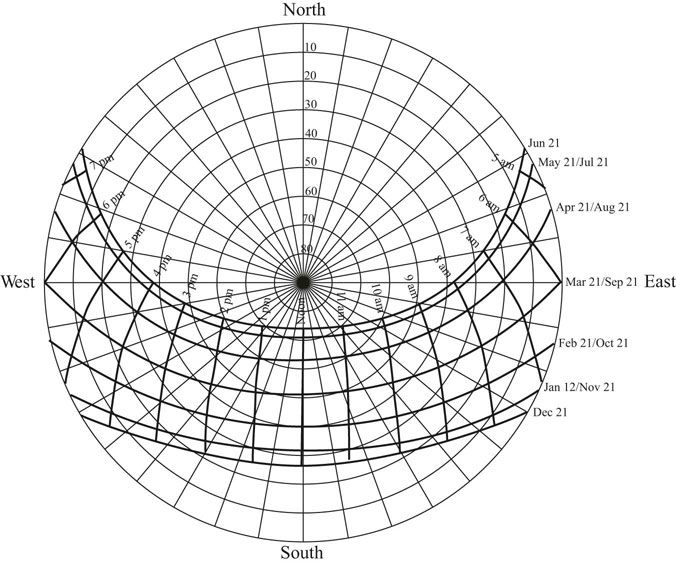
FIGURE 13.2 The Sun path diagram for 40 degrees north latitude.
Source: Moore 1993.
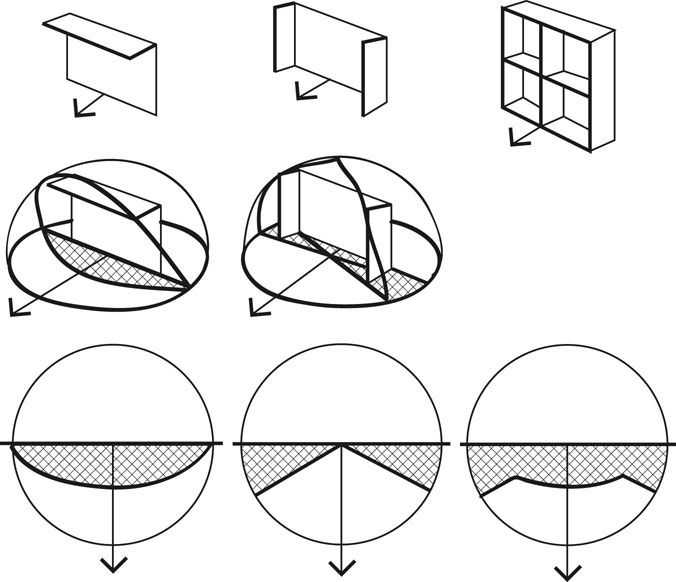
FIGURE 13.3 A conceptual diagram of how shading devices map onto the Sun path diagram.
Source: Olgyay, Victor. Design With Climate. Copyright 1963: Princeton University Press. 1991 renewed PUP. Reprinted by permission of Princeton University Press.
A section through a window can illustrate how a horizontal overhang protects the window from the summer Sun, which is high in the southern sky (Figure 13.4). The overhang blocks out the sky from the zenith through 25 degrees. When the Sun is in this part of the sky, no sunlight hits the window. When the Sun is lower than this in the sky, some sunlight hits the window. When the Sun is very low in the sky, the entire window is exposed to the Sun.
The part of the sky that is blocked out by a horizontal overhang can be plotted on the sun path diagram (Figure 13.5). First draw an arrow from the zenith, the center of the sky, to the horizon indicating the direction the window is facing. Then draw a line perpendicular to the arrow through the center of the sky to both horizons. This represents the wall the window is in. Anytime the Sun is behind this line the Sun is not hitting this wall. Then for an overhang that cuts out 25 degrees of the sky, count down from the center of the sky along the arrow line 25 degrees, or count up along the arrow line from the horizon 65 degrees. Then draw a curve through this point that starts and ends where the wall line meets the horizon line. This curve is a segment of a circle. If this horizontal overhang extends very far out in both directions from the window, the area between the curved line and the wall line represents the part of the sky completely blocked out. Any time the Sun is in this part of the sky the window will be in 100 percent shade. When the Sun is near this part of the sky the window will be in partial shade. When the Sun is far away from this part of the sky the window will be exposed to significant solar gain.
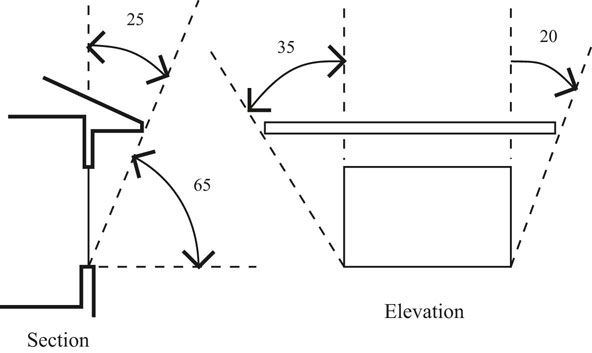
FIGURE 13.4 The parts of the sky that are blocked out by a horizontal overhang can be defined with cutoff angles.
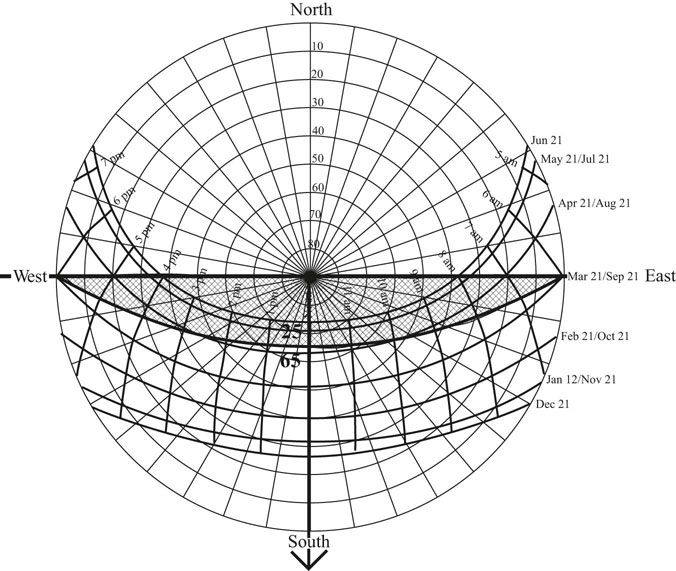
FIGURE 13.5 Plotting the 100 percent shading mask for a horizontal overhang with a 25 degree cutoff angle and an infinite extent on either side of the window.
Most horizontal overhangs do not extend to infinity on either side of a window. To plot the 100 percent shaded area, measure the angles in elevation from the bottom edge of the window to the horizontal extent of the overhang. These angles are plotted from the center of the sky outward along the wall line (Figure 13.6). Then a curve is drawn from these points down to the point on the horizon where the arrow line meets the horizon. These curves are also segments of a circle. The 100 percent shade part of the sky is now only the area bounded by these curves and the horizontal overhang curve. At other times where the Sun paths are near this area, the window will be partially shaded.
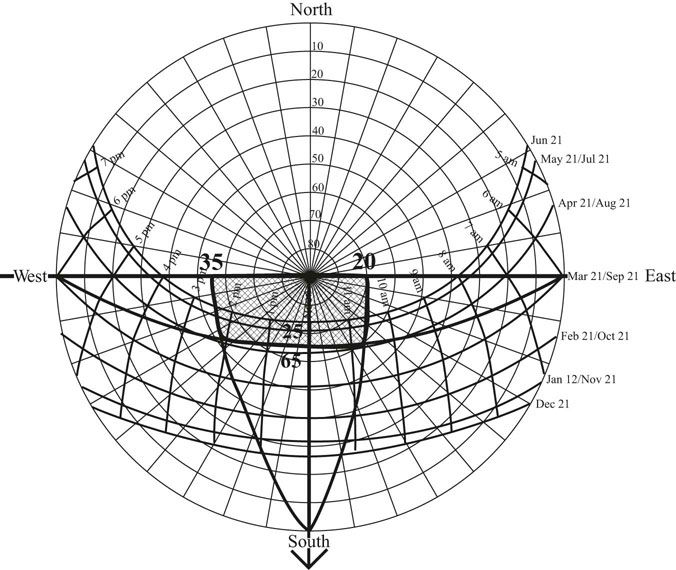
FIGURE 13.6 Plotting the 100 percent shading mask for a horizontal overhang with a 25 degree cutoff angle that extends beyond the window by a limited amount.
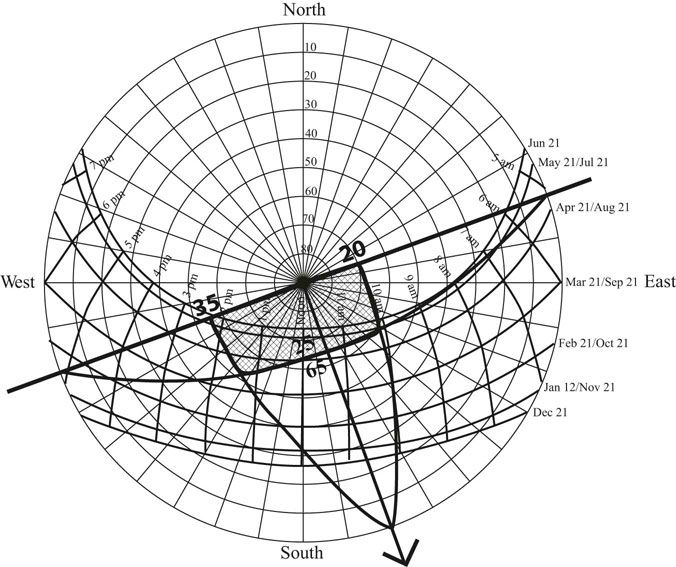
FIGURE 13.7 For a window facing 20 degrees east of south, the whole shading mask armature is rotated 20 degrees.
If a house is oriented 20 degrees east of south, as bioclimatic design would suggest, the entire shading diagram rotates 20 degrees to the east (Figure 13.7). The arrow line goes from the center of the sky to the horizon at 20 degrees east of south. The wall line, perpendicular to the arrow line, starts 20 degrees south of west, runs through the center of the sky, and ends 20 degrees north of east. All the plotting described above is then overlayed on this rotated manifold.
Vertical fins are another shading device for windows. Fins block out part of the sky on either side of the window. If you hold your hands up on either side of your face your vision to either side is obstructed.
To determine how much of the sky is blocked out, measure the angle in plan from the far side of the window past the outside edge of the fin (Figure 13.8). This angle is plotted on the Sun chart along the horizon line from the back line representing the orientation of the wall toward the south (Figure 13.9). Then a line is drawn from this point to the center of the sky resulting in a wedge shape.
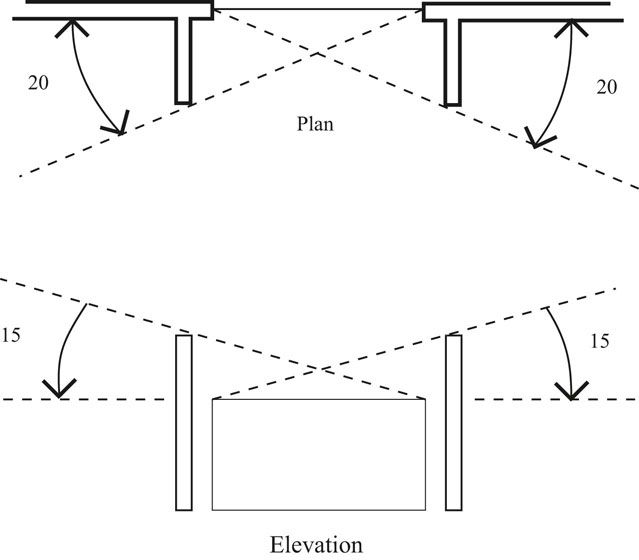
FIGURE 13.8 The parts of the sky that are blocked out by a vertical fin can be defined with cutoff angles.
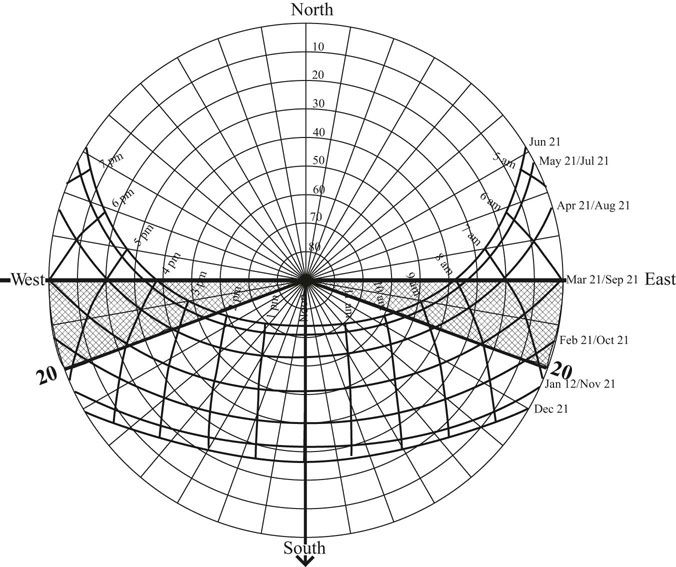
FIGURE 13.9 Plotting the 100 percent shading mask for fins with a 20 degree cutoff angle that extend an infinite amount above the window.
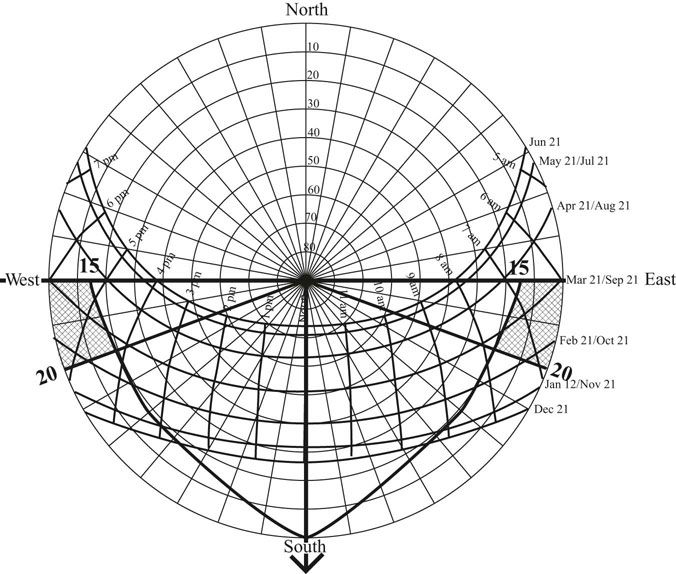
FIGURE 13.10 Plotting the 100 percent shading mask for fins with a 20 degree cutoff angle that extend a modest amount above the window.
The shaded-in area is only in complete shade if the fins extend upward to infinity above the window. Otherwise only part of the wedge shape will be in complete shade.
For fins that extend above the window, measure in elevation the angle from the far side of the top of the window to the top edge of the fin extending above the window. This determines the altitude angle of the Sun below which the Sun will not strike the window. Mark this altitude angle measurement from the horizontal line along the wall line toward the center of the sky (Figure 13.10). Then draw a curve from that point down to the point where the arrow line meets the horizon. Only the area in the wedge that lies between the horizon line and this new curve will be in complete shade. As with a horizontal overhang, areas near the 100 percent shade area will have significant shading, and areas far away from the 100 percent shade area will have very little shading.
Combining a horizontal overhang with vertical fins provides a potent shading device (Figure 13.11). The fins complete the horizontal overhang to infinity and the horizontal overhang completes the fins to infinity. The shaded area shows the times of the year where the Sun does not strike the window (Figure 13.12). Times near to this complete shading area will have partial shading. Times far away from the complete shade area will have little shading.
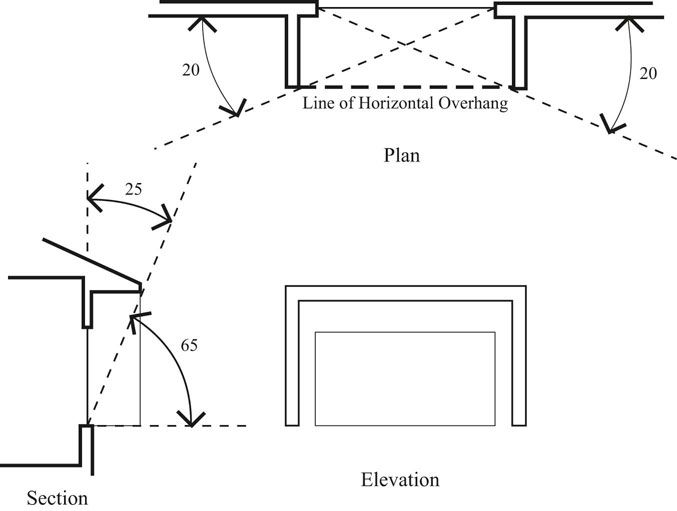
FIGURE 13.11 The parts of the sky that are blocked out by a combination of a horizontal overhang with vertical fin can be defined with cutoff angles.
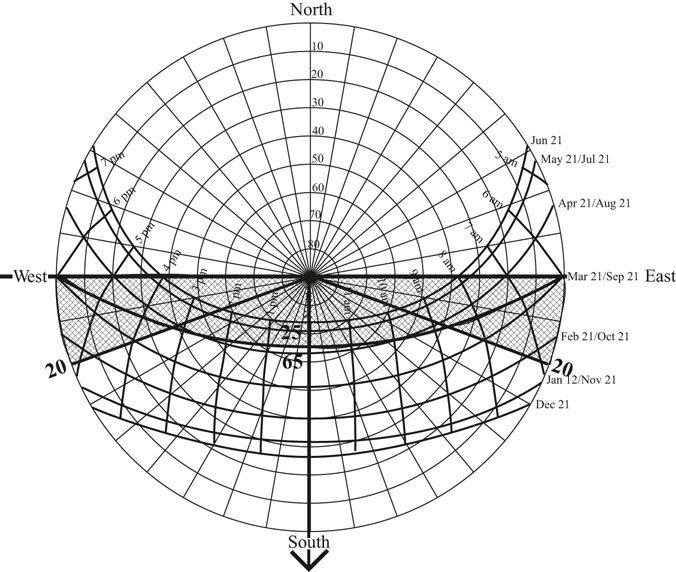
FIGURE 13.12 Plotting the 100 percent shading mask for the combination of an overhang and fins.
The comfort zone is defined as providing comfort for a person in light clothes in the shade. The shading specification is defined to provide complete shade for the times when the air temperature is above the comfort zone, rather than also including the comfort zone, because to include the comfort zone in the complete shading specification would over shade the window (see Figure 13.13). The desire is to shade the window during the summer months but to allow solar penetration during the winter months. Setting the shading specification at the top of the comfort range provides this balance between summer shade and winter penetration.
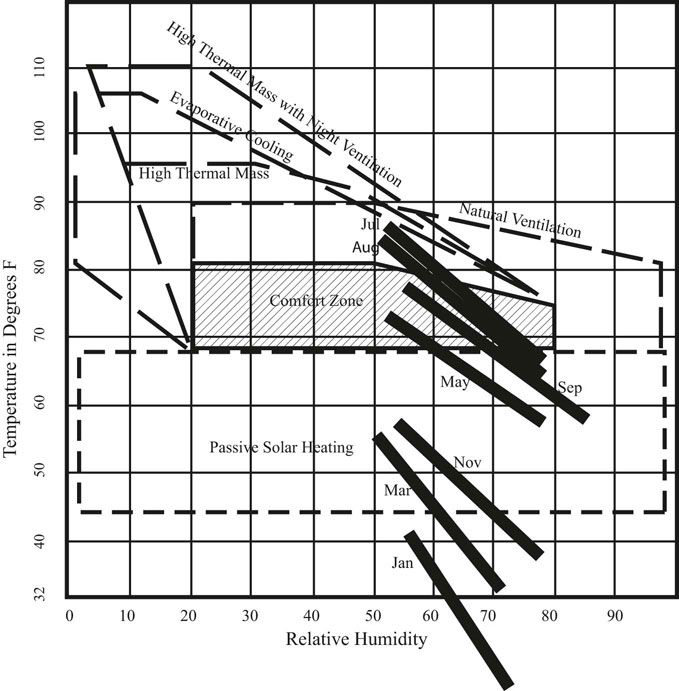
FIGURE 13.13 Weather data for Baltimore, Maryland, plotted on the bioclimatic chart can be used to define the overheated months of the year.
Source: Bioclimatic chart, Brown and DeKay 2001. Climate plot, Carl Bovill.
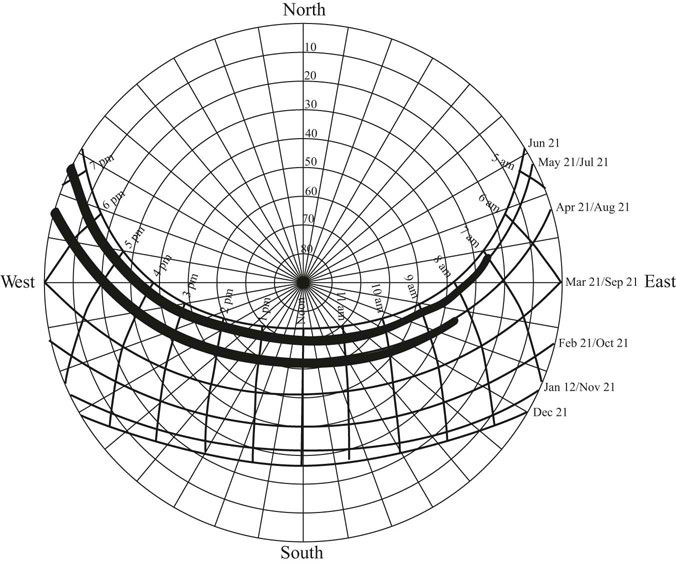
FIGURE 13.14 The overheated period can be transferred from the bioclimatic chart to the sun chart.
The peak temperature of the day happens in the early afternoon, which means that the upper half of the plot lines representing each month in Figure 13.13 represent the daytime part of the plot. On the bioclimatic plot for Baltimore, Maryland, July is completely above the comfort zone during the day. August is also above the comfort zone from midmorning on. September is in the comfort zone during the day. Using this information from the climate plotted on the bio-climatic chart, the overheated period for Baltimore, Maryland, can be plotted onto the sun chart (Figure 13.14). The overheated period on the sun chart can then be used to create a specification for an appropriate shading configuration.
To construct the shading device specification (Figure 13.15), first draw the arrow line in the direction the window faces and the wall line perpendicular to the arrow line. Then draw a curve from one end of the wall line that just skims the bottom of the overheated period to the other end of the wall line. This curve sets the horizontal overhang cutoff angle. Then draw a curve toward the west that starts at the intersection of the arrow line and the horizon and meets the wall line where it just covers up the overheated period. Draw a similar line toward the east. These two lines will provide a specification of how far the horizontal overhang should continue past the end of the window (Figure 13.16; see also Figure 13.17).
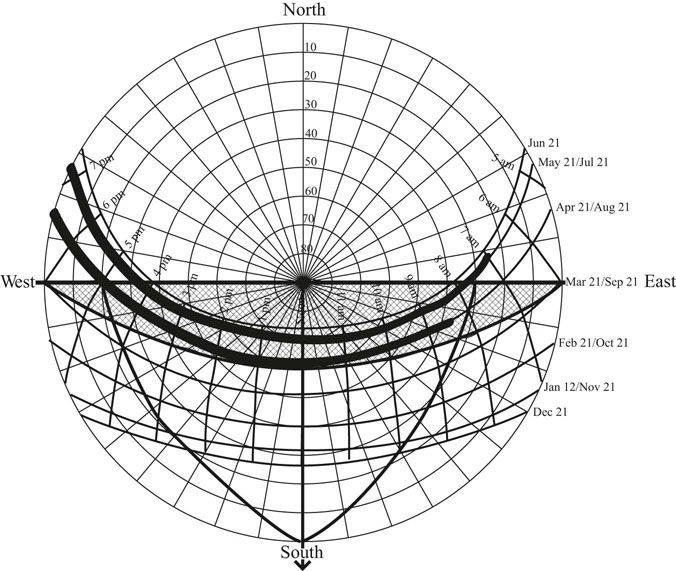
FIGURE 13.15 A shading mask can be constructed that will cover the overheated period in order to define the cutoff angles of the required horizontal overhang.
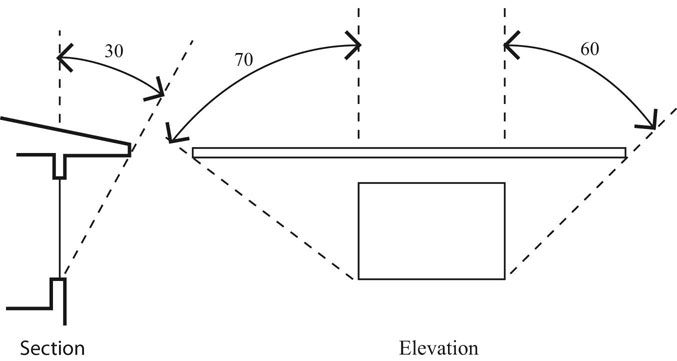
FIGURE 13.16 The horizontal overhang in section and elevation that was determined by the shading mask constructed in Figure 13.15.
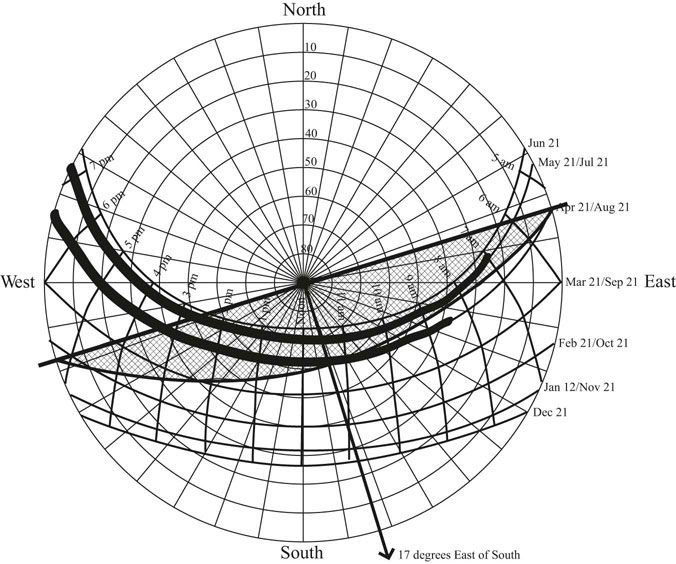
FIGURE 13.17 If the building is rotated 17 degrees east of south it receives a little boost of morning sun and avoids afternoon sun.
The reality is that the horizontal overhang is likely to run all the way along the southern elevation of the house. The overhang will not continue past the end of the house. The simple way to make the overhang effective all the way along the southern elevation is to plant a tree at the south-east end of the house and another tree at the south-west end of the house. The trees then act as fins at the end of the horizontal overhang completing the horizontal overhang to infinity (Figure 13.18). In addition the trees shade the roof from solar gain especially in the afternoon when the air temperature is highest.
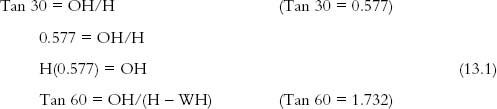
A little trigonometry can help determine the optimum horizontal overhang. Look at the sun chart with the overheated period and the horizontal over-hang specification. The chart calls for blocking the sun anytime that the altitude angle is greater than 60 degrees. In January at noon the altitude of the sun is 30 degrees. One would like the window to be wide open to solar penetration in January. A section diagram of a window with a horizontal overhang can be used to set up the trigonometry to determine the location and extent of an optimum overhang that blocks out the summer sun and lets in the winter sun (Figures 13.19 and 13.20).
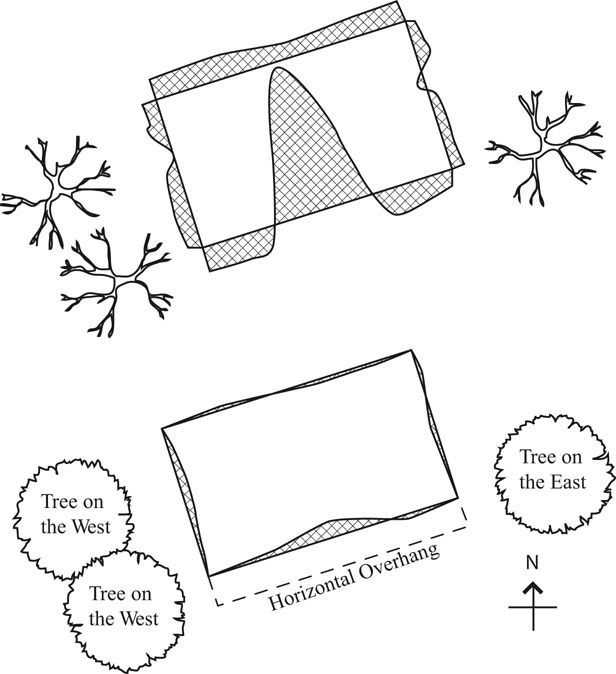
FIGURE 13.18 Trees planted to the west and east of a house act as large fins making the horizontal overhang more effective.
Source: Olgyay, Victor. Design With Climate. Copyright 1963: Princeton University Press. 1991 renewed PUP. Reprinted by permission of Princeton University Press.
Setting WH to 4.5 feet,
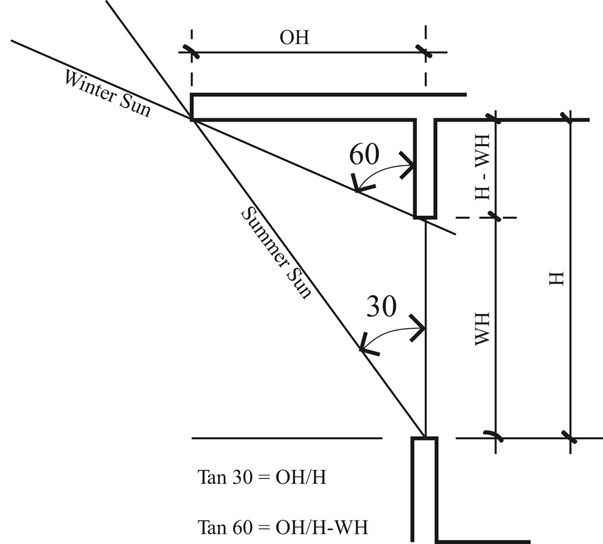
FIGURE 13.19 An optimum overhang lets the winter sun in and blocks the summer sun. Trigonometric equations can be used to solve for the optimum overhang dimension in relation to window height.
Substituting Equation (13.1) (H(0.577) = OH) into Equation (13.2) yields:
H(1.732) = H(0.577) + 7.794
H(1.155) = 7.794
H = 6.742 feet or 6 feet 9 inches
Substituting the H back into Equation 13.1, gives the overhang dimension
H(0.577) = OH
(6.742)(0.577) = OH
OH = 3.89 feet or 3 feet 10½ inches
The bottom edge of the overhang is equal to the window height (H) plus the window sill height (2.5 feet) which gives the ceiling height:
6.743 feet + 2.5 feet = 9.243 feet or 9 feet 3 inches
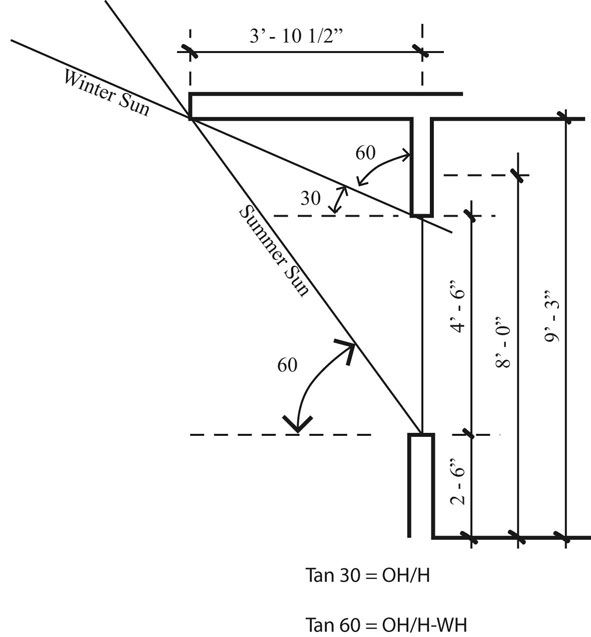
FIGURE 13.20 The solution to the optimum overhang problem creates an interior ceiling height higher than 8 feet.
With a two and a half foot window sill height and a window height of 4.5 feet, which allows for the header framing above the window, the relationship between the height from the window sill to the ceiling and the extent of the overhang is two to one (Figure 13.21). The two to one ratio is a compromise but provides an easy to remember design heuristic.
The same ratio also works well as one looks at warmer locations further south than the 40 degree north latitude of Baltimore, Maryland. The reason the same ratio works is that as the overheated period expands to include another month, the sun paths through the sky move to be more overhead. The ratio also works as one looks at colder climates further north. The overhang will block out less of the summer sun as the sun paths move lower in the sky but the summer is shorter as one goes north. Of course the best procedure is to plot the weather on the bioclimatic chart followed by a plot of the overheated period on the sun chart. The resulting shading design will then be tuned to the local circumstances.
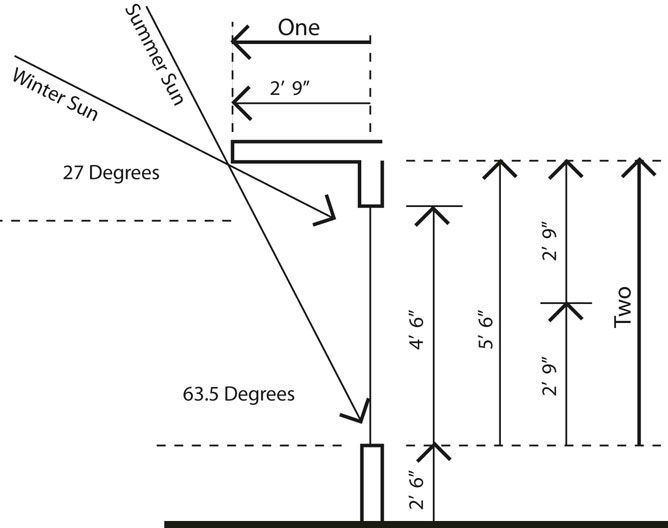
FIGURE 13.21 A compromise solution to the optimum overhang problem with realistic window size and ceiling height creates a two to one relationship between window height and overhang depth.