Orienting a house to the south or slightly east of south opens south windows to accept solar gain in the winter when the sun is low in the southern sky (Figure 13.1). A southern orientation also helps to exclude solar gain in the summer when the sun is high in the southern sky. An understanding of where the sun is in the sky and how to construct shading devices to allow winter sun to penetrate while excluding summer sun is central to passive solar design.
To properly design solar shading devices it is necessary to understand solar diagrams and how to plot the performance of shading devices in diagrams. The path of the sun across the sky dome can be projected onto a horizontal surface (Figure 13.2). The horizon is represented by the circumference of the circular diagram. The concentric rings represent 10 degree increases in altitude, from 0 degrees at the horizon on the outer ring of the diagram, to 90 degrees at the center of the diagram. These angles are referred to as altitude angles. The lines that form spokes on the diagram count out 10 degree increments along the ground plane. These angles are referred to as azimuth angles. The path of the Sun is plotted on top of this polar diagram by month and time of day. The time markings on the chart are solar time not standard or daylight savings times. Solar time is defined by positioning noon at the point where the Sun is halfway across the sky. As an example of how to read the time lines look at December on the 40 degree north latitude Sun chart. The Sun rises 59 degrees east of south at about 7:30am, at noon the Sun is due south and at an altitude angle of 27 degrees, and the Sun sets 59 degrees west of south at about 4:30pm.
The parts of the sky that shading devices cover up can be plotted on the sun path diagram (Figure 13.3). The area of the sky that is covered by a shading device represents the times of the year when the Sun does not strike the window because the shading device is blocking the sun. The Sun path diagram represents the view of the sky that the entire window sees. To get a feeling for this idea consider your eyes to be a window. If you put your hand above your eyes you cannot see the part of the sky your hand blocks out. Whenever the sun is in that part of the sky your eyes, or the window, will be in shade. If you hold your hands up on either side of your eyes there will be parts of the sky on either side of you that you cannot see.
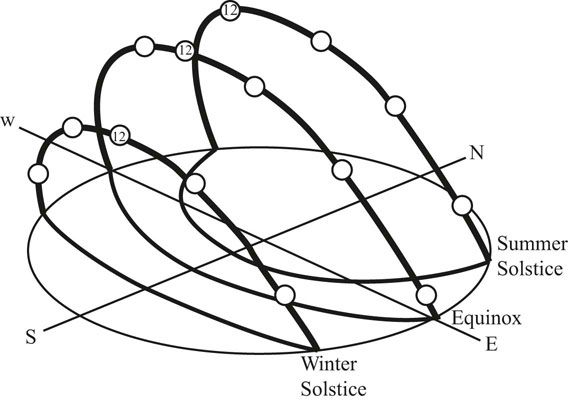
FIGURE 13.1 Creating a flat map of the position of the Sun in the sky vault.
Source: Olgyay, Victor. Design With Climate. Copyright 1963: Princeton University Press. 1991 renewed PUP. Reprinted by permission of Princeton University Press.
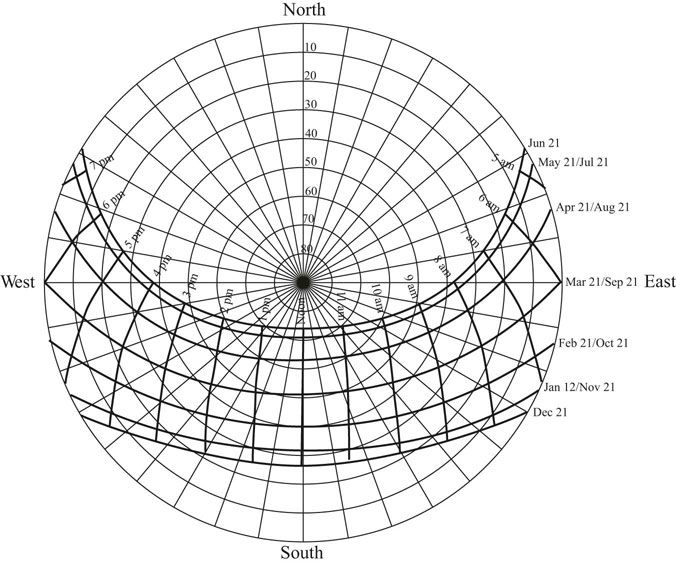
FIGURE 13.2 The Sun path diagram for 40 degrees north latitude.
Source: Moore 1993.
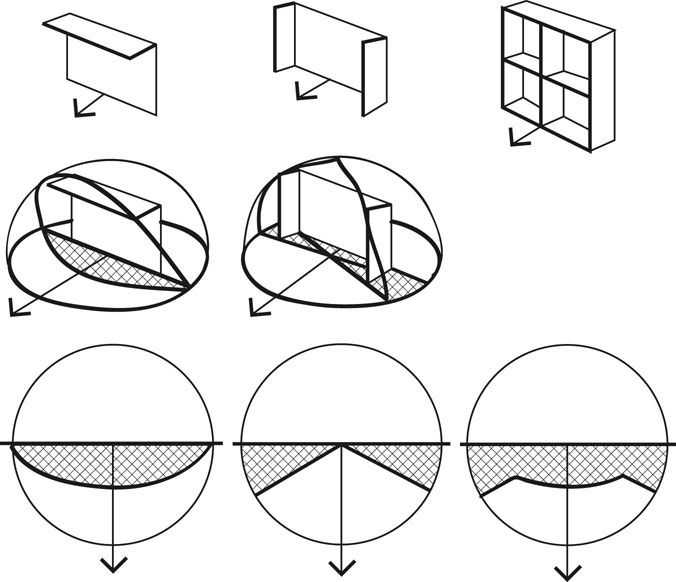
FIGURE 13.3 A conceptual diagram of how shading devices map onto the Sun path diagram.
Source: Olgyay, Victor. Design With Climate. Copyright 1963: Princeton University Press. 1991 renewed PUP. Reprinted by permission of Princeton University Press.
A section through a window can illustrate how a horizontal overhang protects the window from the summer Sun, which is high in the southern sky (Figure 13.4). The overhang blocks out the sky from the zenith through 25 degrees. When the Sun is in this part of the sky, no sunlight hits the window. When the Sun is lower than this in the sky, some sunlight hits the window. When the Sun is very low in the sky, the entire window is exposed to the Sun.
The part of the sky that is blocked out by a horizontal overhang can be plotted on the sun path diagram (Figure 13.5). First draw an arrow from the zenith, the center of the sky, to the horizon indicating the direction the window is facing. Then draw a line perpendicular to the arrow through the center of the sky to both horizons. This represents the wall the window is in. Anytime the Sun is behind this line the Sun is not hitting this wall. Then for an overhang that cuts out 25 degrees of the sky, count down from the center of the sky along the arrow line 25 degrees, or count up along the arrow line from the horizon 65 degrees. Then draw a curve through this point that starts and ends where the wall line meets the horizon line. This curve is a segment of a circle. If this horizontal overhang extends very far out in both directions from the window, the area between the curved line and the wall line represents the part of the sky completely blocked out. Any time the Sun is in this part of the sky the window will be in 100 percent shade. When the Sun is near this part of the sky the window will be in partial shade. When the Sun is far away from this part of the sky the window will be exposed to significant solar gain.
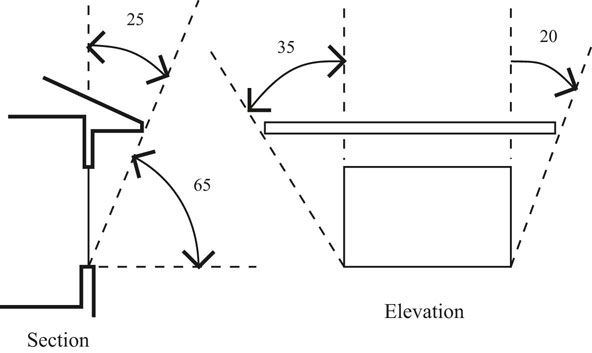
FIGURE 13.4 The parts of the sky that are blocked out by a horizontal overhang can be defined with cutoff angles.
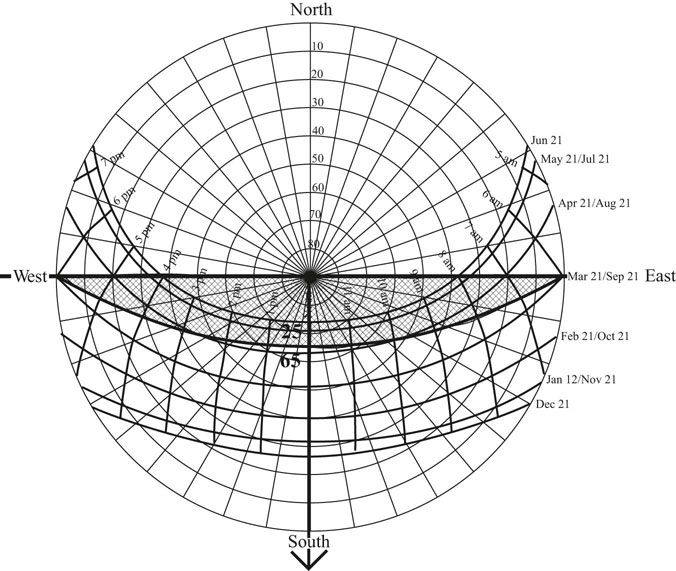
FIGURE 13.5 Plotting the 100 percent shading mask for a horizontal overhang with a 25 degree cutoff angle and an infinite extent on either side of the window.
Most horizontal overhangs do not extend to infinity on either side of a window. To plot the 100 percent shaded area, measure the angles in elevation from the bottom edge of the window to the horizontal extent of the overhang. These angles are plotted from the center of the sky outward along the wall line (Figure 13.6). Then a curve is drawn from these points down to the point on the horizon where the arrow line meets the horizon. These curves are also segments of a circle. The 100 percent shade part of the sky is now only the area bounded by these curves and the horizontal overhang curve. At other times where the Sun paths are near this area, the window will be partially shaded.