5
SPACE OF REPRESENTATION
The Generative Maps of Perry Kulper and Smout Allen
“That’s another thing we’ve learned from your Nation,” said Mein Herr, “map-making. But we’ve carried it much further than you. What do you consider the largest map that would be really useful?”
“About six inches to the mile.”
“Only six inches!” exclaimed Mein Herr. “We very soon got to six yards to the mile. Then we tried a hundred yards to the mile. And then came the grandest idea of all! We actually made a map of the country, on the scale of a mile to the mile!”
“Have you used it much?” I enquired.
“It has never been spread out, yet,” said Mein Herr: “The farmers object: they said it would cover the whole country, and shut out the sunlight! So we now use the country itself, as its own map, and I assure you it does nearly as well. Now let me ask you another question. What is the smallest world you would care to inhabit…?”
Lewis Carroll “Sylvie and Bruno Concluded”
In that Empire, the Art of Cartography attained such Perfection that the map of a single Province occupied the entirety of a City, and the map of the Empire, the entirety of a Province. In time, those Unconscionable Maps no longer satisfied, and the Cartographers Guilds struck a Map of the Empire whose size was that of the Empire, and which coincided point for point with it. The following Generations, who were not so fond of the Study of Cartography as their Forebears had been, saw that that vast Map was Useless, and not without some Pitilessness was it, that they delivered it up to the Inclemencies of Sun and Winters. In the Deserts of the West, still today, there are Tattered Ruins of that Map, inhabited by Animals and Beggars; in all the Land there is no other Relic of the Disciplines of Geography.
Suarez Miranda,Viajes de varones prudentes, Libro IV,Cap. XLV, Lerida, 1658
Borges “On Exactitude in Science”
Based on an earlier writing by Lewis Carroll, this well-known extract by Borges from the short story “On Exactitude in Science” about the art of cartography and the role of maps, while overtly referring to scale alludes to broader issues of representation and reality in addition to engaging and occupying representational space. Both narratives point to questions of spatial abstraction and the role of representation that is instrumental in creating it. These aspects become pronounced when it comes to architecture and it is this that the chapter focuses on. It examines mapping as a mode of representation, its role in the construction of the design brief and ultimately design generation. What is perhaps of significance to note at least for the purpose of this discussion is that the act of mapping suggests translation – translation from a phenomenon into visual abstraction. How this translation occurs is, therefore, critical when mapping is the apparatus through which design is generated.
Notations (symbols) and indexes are integral to this technique so Peirce’s well-known categories of the sign directly apply to the act of mapping. Using symbols and indexes to depict patterns and relationships between elements in space, mapping has often been used to suggest ordering, classification, and revealing the invisible or comprehending the incomprehensible. As a mode of representation that uses notational systems, mapping when deployed in architectural drawing would be what Nelson Goodman would call allographic. Goodman in his distinction between the allographic and autographic arts discusses the unusual nature of architecture which has aspects of both: “The architect’s papers are a curious mixture,” he writes, further stating that “the specifications are written in ordinary discursive verbal and numerical language. The renderings made to convey the appearance of the finished building are sketches.”1 This unusual mixture makes certain architectural representations particularly interesting, since, for Goodman, it is the codified nature of graphic information present in architectural drawings that make them allographic in nature. This make mapping as a technique that influences design that has become more prevalent in last few decades particularly fascinating. This is apparent when one considers the creative use of data mapping in MVRDV’s work or FOA’s mapping of programmatic usage and spatial flow that inform the Yokohama Terminal design. My interest in this chapter is to examine certain drawings used in architectural design wherein the technique of mapping as a design tool seems specifically apparent. The notion that mapping is integral to design is especially prevalent in the writing of certain designers such as James Corner who stresses that, “the very basis upon which projects are imagined and realized derives precisely from how maps are made,” further elaborating that “mapping is perhaps the most formative and creative act of any design process, first disclosing and then staging the conditions of the emergence of new realities.”2 It is this construction of “new realities” that makes this representative tool especially significant in design formulation. So the question becomes, how does mapping become a generative process? What is it in the representative tool kit of techniques that lends itself to mapping being generative?
Mapping as an act of visual translation could be in terms of specific information, site data, programmatic issues, or other analogical and metaphoric aspects that are directly significant to context and program. This act of translation makes it an important generative tool in design. In this chapter, I make the case that Constant Nieuwyenhuys’ collage-like New Babylon maps are certainly generative; Perry Kulper’s drawings, I argue, can be considered as metaphorical maps that are instrumental in generating a design brief; Smout Allen’s projects Panorama Landmarks and Retreating Village which transform architecture to an instrument of registering and mapping the landscape are almost a manifestation of the Carroll and Borges story, and finally, Lebbeus Woods’ project, System Wein, is an enactment of a map.
Collage vs Montage Maps
Situationists treated maps as terrains for exploration that were appropriated and operated upon to give a new understanding of the city. This is evident in the now famous cut-up collage maps created by Debord and Jorn of Paris highlighting “psychogeographic” sites. The aim of these collage maps was to question the status-quo and deliberately distort the conventional understanding of the city. In a similar manner, Constant Nieuwyenhuys’ New Babylon collage maps rearrange and reorder the existing city into a new city. The symbolic representation of New Babylon has cut-out sectors from maps of various cities in Europe that are overlapped and form ring-like entities which are connected by lines around a center. Overlapped gray boxes go across the collaged maps like connectors between the pieces.
These collage maps of New Babylon have all the notations of conventional maps since they are created from individual parts of existing maps to form a new whole that becomes the register of new ideas. This representational space has been called, “a calculated assault on disciplinary limits, and drawing is a key part of that arsenal.”3 While initially the drawings explored the spaces that had been generated, according to Wigley, as more collage techniques were added to these drawings, new kinds of spaces had been generated within them.4 So while the use of maps was significant, it was the technique of collage that was instrumental in the generation of new kind of spaces and therefore, it is the transformation into collage maps that is important for design generation.
The representation technique of collage complements the idea of play that is embedded in the continual changes that the inhabitants of New Babylon could make within their architectural environment and naturally alters how one views the maps. The collage maps transform the understanding of this project from being viewed as a stable condition (that is almost crystallized and static) to depicting effects that are already present and would be in a continuously evolving condition. The New Babylon maps provide a structure or frame for a combinatorial game and a snapshot at a moment in time:
The inhabitants drift by foot though the huge labyrinthine interiors, perpetually reconstructing every aspect of the environment by changing the lighting and reconfiguring the mobile and temporary walls. For this homo ludens, social life becomes architectural play and the multiply interpretable architecture becomes a shimmering display of interacting desires – a collective form of creativity, as it were, displacing the traditional arts altogether.5
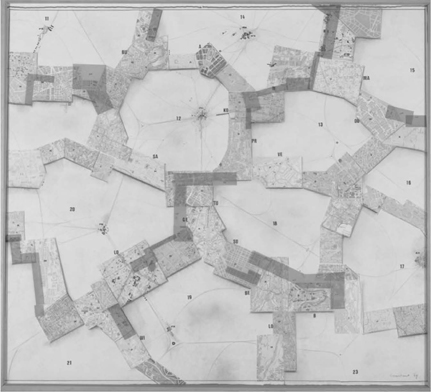
FIGURE 5.1 Constant Nieuwyenhuys, Symbolische voorstelling van New Babylon [Symbolic representation of New Babylon], 1969 (collage 48¹∕₁₆ × 52⅜ in. Gemeentemuseum, The Hague)
This description is very much like a combinatorial game that points to a living map which is not frozen in representation but is constantly evolving. For Wigley this “blurriness” of what actually happens within the living space, an undefined indeterminacy seen in Constant’s models and drawings, is set against the exacting and specific demonstrations of how the space is made possible. He writes, “inside, things are always blurry… Constant continually blurs both the play of desire, which cannot be specified without blocking it, and the support of that play, which cannot be represented without it being mistaken for frozen play.”6 The collage technique used in Constant’s mapping highlights juxtapositions of materials and fragmentary conditions this is seen in the etched plastic and acrylic pieces with symbolic notations that are deployed in some representations. The use of different traditional maps as well as other means of representation give the sense of various possibilities and project a sense of multiplicity of experiences as well.
With the New Babylon maps, one observes individual pieces that use conventional maps which have notational techniques that are essentially allographic nature but it is the nature of the overall composition using the collage technique that makes this generative mapping autographic. Constant’s collage is another way of considering mapping that combines and exhibits information simultaneously, whether layered, or fragmented. The visual synchronicity – a simultaneous manner of revealing and juxtaposing information – seen in Constant’s representations seems to be a hallmark and a significant trigger for design generation in the work of other designers as well.
In contrast to Constant’s maps that use the collage technique, James Corner writes about his maps as montages. For Corner, the rhizomatic mapping process that he describes is as “a mode of work integral to collage” and functions “connotatively” which is by suggestion. This process is different to the typical mapping process that for Corner “systematizes its materials into more analytical and denotative schemas. Where mappings may become more inclusive and suggestive, then, is less through collage, which works with fragments, and more through a form of systematic montage, where multiple and independent layers are incorporated as a synthetic composite.”7 According to this distinction, data maps form a closed system that is systematic and analytical, moreover, denotative schemas through a “systematic montage” situate it more towards one end of the spectrum that constitutes disjointed notational systems while connotative schemas that are inherent in the collage technique – an autographic practice – situates it towards the other end of the spectrum. While Corner’s distinction between collage and montage maps is accurate, where this distinction gets a little tricky is in the actual separation between denotative and connotative schemas in montage and collage. For instance, even if Corner considers his own work to be more akin to a systematic montage, one finds connotative aspects within it that have metaphorical projective capacities, and, while Corner himself admits that his own maps which subvert the geological maps are “not as open or rhizomatic as they might be owing to their thematic focus,”8 since to a certain extent these are systematic, and analytical in conveying information, they also reveal connotative schemas. The mode in which they do so is through the employment of three operations: defining the field or geographic conditions, deterretorialization, and reterritorialization.9 These methods, then, offer new readings in the manner in which cartographic relationships are established and are statements of projective capabilities of mapping. Quite elegant in themselves, one can argue that Corner’s own maps are not strictly notational systems but can be considered as artifacts in their own right and in that sense more akin to paintings when considered in the spectrum from disjointed notational systems to dense systems. His maps reveal an interesting mix of the informative and the projective, the connotative and the denotative, the codified and the suggestive.
Maps as a Design Briefs in Perry Kulper’s Work
Visual flights of the imagination, Perry Kulper’s striking architectural drawings at first glance almost look like paintings. A closer look, however, unveils layers of relational meaning – they come across as maps complete with symbolic notations on the one hand to figurative imagery on the other hand. In Perry Kulper’s case, his drawings that have attributes of mapping can be considered a device through which he develops the design brief. Here I’m using the art historian Michael Baxandall’s explanation of “charge” and “brief” wherein he says: “The Charge is featureless. Character begins with the Brief.”10 The “charge” essentially refers to the typology or function and it is the local and circumstantial conditions that formulate the design brief. In the projects discussed further, I contend that the creative mapping of conditions becomes a way to develop not only the design “brief” but in some instances, such as the David’s Island Project, the “charge” itself. Kulper’s drawings have been referred to as a kind of personal cartography.11 Three projects by Kulper are especially pertinent in this discussion: the David’s Island project (drawings made: 1996–97), the Central California History Museum (drawings made: 2001–02, 2009–10), and the Fast Twitch Desert House (drawings made: 2004, 2008, 2010).
The David’s Island competition project was an ideas competition without a prescribed program. Formulating the design brief was therefore an integral component of the representations. Historical events, indigenous populations, earlier building typologies and programs that occurred on the island, as well as the natural environment and geographical features, are all important features that are mapped. Drawings for this project therefore are distinctive mappings that constitute a layered construction, which registers various features, events, and significant landmarks of the island. To this system of layering there are also layers of photographs of found images and text. In addition, Kulper uses a combination of codified military and nautical cartography and notational systems that construct and question theoretical and ideological relations such as the very boundary and margins of events, ideas, and site. For him all aspects that are important to formulate both the design charge an brief are embedded in the construction of these collage drawings, including essential features of the site in terms of history, experience, and projected purpose,
the islander’s experience of remoteness and isolation, the propagation of maritime mythologies and folklore, the manifestations of successive insurgencies and divergent occupations, the cultural import of drift, migration and transience, the latent potential for constructed inundations, the real and imagined sensing of suppressive scopic (panoramic and panoptic) regimes, the representational practices and influences of nautical cartography, the prospective elusiveness of nocturnal ephemera and the literal and strategic deployment of military jargon,
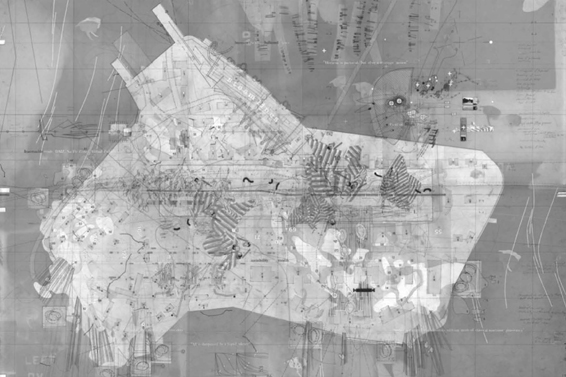
FIGURE 5.2 David’s Island Competition project, Strategic Plot and Site Drawing, 1996–97, (24 × 36 in, materials: Mylar, x-rays, assorted found imagery, cut paper, foil, transfer letters, transfer film, tape, graphite, ink, courtesy Perry Kulper)
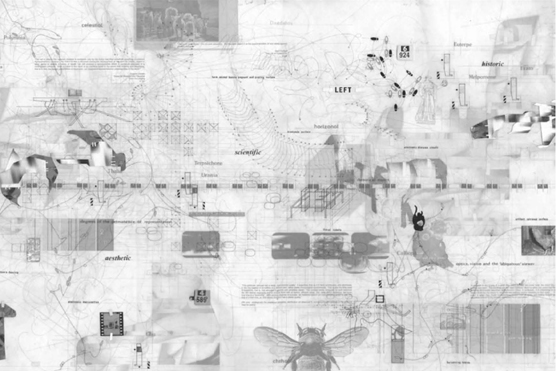
FIGURE 5.3 Central California History Museum, Thematic Drawing, 2001–02, 2009, 2010, (24 × 36 in, materials: Mylar, assorted found imagery, cut paper, acetate, transfer letters, tape, graphite, ink, courtesy Perry Kulper)
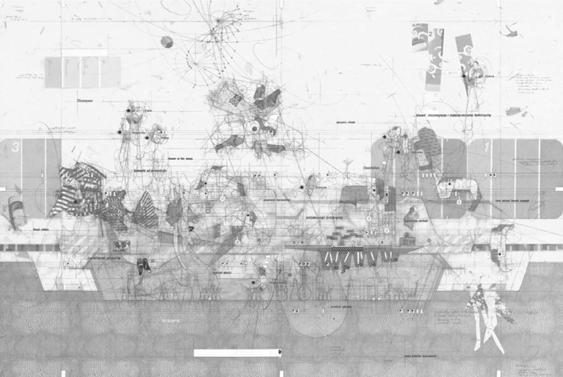
FIGURE 5.4 Central California History Museum, Section Drawing, 2001–02, 2009, 2010, (24 × 36 in, materials: Mylar, assorted found imagery, cut paper, acetate, transfer letters, tape, graphite, ink, courtesy Perry Kulper)
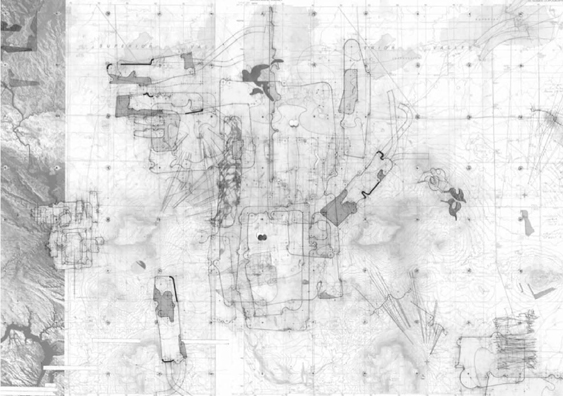
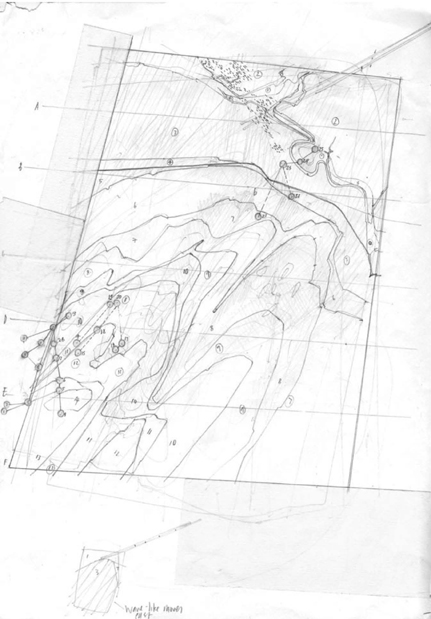
FIGURE 5.5 Fast Twitch Desert Dwelling, Site Plan, 2004, 2008, 2010, (24 × 36 in, materials: Mylar, transfer letters, graphite, found imagery, satellite photo, courtesy Perry Kulper)
a number of specific tactics are initiated, primarily through drawing. The Strategic Plot oscillates between concrete spatial proposals and notations for further development. One can inhabit and even get lost in various within different parts of the drawing, each part of the space of the representation generating its own story. The combination of different techniques of representation in the form of more disjointed ones, such notations, words, and more figurative ones that include photographs, and figurative drawings, that come together helps create these individual narratives that relate to each other, but at the same time can trigger their own individual narrative. Representational borders are opened with the hope of sustaining a more fluid ideological, critical and material amalgamation.
The very reference to the drawing as a “strategic plot” in itself is quite telling in that the plot signifies the manner in which the story is constructed and planned. It marks, lays out, and locates the underlying story but there is also another side to this meaning, that of intrigue and secrecy. While in Kulper’s case it is the construction of the map, planning, and marking that creates the design brief and identifies where interventions are possible, there is an intrigue to uncovering and reading the layers to discover potential relationships. Here it also constructs and reveals the charge and develops the design brief.
There are some similarities in the approach and techniques of the David’s Island drawings with the thematic drawing of Central California History Museum, especially when it comes to the construction of a layered collage and the use of notations. In this project multiple notational systems are employed that range from dance notations to scientific and architectural ones. It includes words, numbers, images, hieroglyphic characters, optical spectrums, repetitions, as well as classificatory systems. References and inspirations from mythology take the form of images and words. In this project there is a more analogical relation and metaphorical connection made between what is represented and conceptual ideas.12 The density of information in the form of both discursive and presentational systems is suggestive of the varied features at play in the formulation of a design brief. Kulper, in his short description of this project, specifically alludes to the techniques of representation saying: “This way of working emerged as a way to circumvent a “crisis of representational reduction”, lodged in many traditional architectural drawings. There is an effort in the making of the drawings to broaden the bandwidth of understanding about the content and structural make up of the proposal and an attempt to develop particular representational techniques appropriate to the phase of development of the work.”13 This “broadening of bandwidth” leads to “thick” drawings where layers of information translated visually augment patterns of relationships, creating a complex web of maps. In a sense, these maps become metaphorical spaces from which the design brief is constructed.
In the description of Central California History Museum, Kulper uses the term “thickened surface.” This term is particularly apt, not just conceptually but also perceptually and in terms of material qualities embedded within the drawings. The thematic drawings reveal the architect as a bricoleur and the heterogeneous expanse of tools and materials that are juggled in order to construct a layered collage underlying which one can see mapping as the organizing force that creates the patterns of relationships. For instance, in the strategic plot, it is not just the manner in which site information is mapped that does not seem to follow the norms of traditional mapping, but the mode in which it is layered that is unique. Instead of the more typical maps that refer to a concrete and real landscape, Kulper’s drawings seem to project a more imaginative and invisible landscape and in the process create an interesting amalgam of the existing visible, the inaccessible invisible, and the projected imaginative. As artifacts in their own right they reveal a material palette that is a construction ranging from Mylar, graphite, ink, tape, found imagery, x-rays, foil, photographs, transfer letters, transfer film, and cut paper. In terms of techniques employed they run the gamut of manual to digital, and with respect to operations of representation they are combination of notational (symbols and text), indexes, images, traditional architectural drawing conventions, as well as mapping techniques. All of this lends a multiplicity of meaning to the work and transforms representation from being strategically framed communicative to being generative – an act that Kulper identifies as, ““local” “ecologies of potential” [that] emerge from this choreography, teasing out spatial possibilities from the drawings.”14 These drawings are not meant to be read as “building,” rather they are more akin to modes of thinking wherein site data is layered with conceptual ways of developing the brief – non-linear lateral thinking that is so significant in design formulation. These works are both denotative and connotative. If one considers these with respect to Nelson Goodman’s dense and discrete systems, Kulper’s representational space, while using attributes of mapping, is unlike a discrete notational system of communication as in technical or instructional drawing but is a dense system that is autographic in nature. The act of layering is indicative of the transformation of material processes as well, and with the density of layering gives the maps a textured quality.
Architecture as Instruments of Denotation in Smout Allen’s Projects
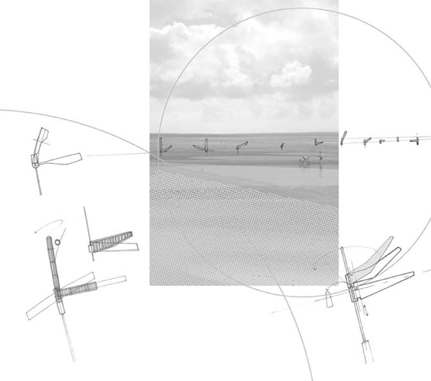
Giving a sensibility of kinetic instruments, Smout Allen’s representations come across as instruments of mapping landscape and space. In fact, in an article that discusses the role of visual representation in their research and design inquiry, Mark Smout writes about the unique role that instruments play with respect to the occupation and experience of the horizon, specifically discussing three ballistic instruments that were designed by their firm.15 One can observe ideas that migrate from these instruments to some of their Panorama Landmarks projects quite explicitly.
Two projects, “Dunes and Drift” and “Dunstable Downs Kite Farm” from the four Panorama Landmarks that share similarities of concept and representation, are especially fascinating when we consider the denotative capacity of maps as markers that register the changes in the landscape. Here architecture is more akin to instruments in landscape that map unseen forces and unstable landscapes. Both projects work with architecture as markers of the landscape almost like a surveyor’s grid. In Dunes and Drift, the Norfolk coast drift markers are not stationary but transform themselves to register the shifting sea and wind. The upper wing reacts to the wind while the instrument acts as a rudder in the lower part responding to the shifting tide. Within the dunes too are markers that take the form of a tub which is revealed or hidden depending on the variation of sand that forms the dunescapes. In addition, they create a temporal marking with their usage when holidaymakers uncover the tub that holds a deck chair, a picnic rug, a shelter, and a cricket bat.16 Shelters are environmental markers and register environmental conditions such as temperature fluctuations and UV light and thus work as instruments that record and can be deployed to create new maps.The Dunstable Downs Kite Farm shares similarities with Dunes and Drift. It takes advantage of wind currents created by the topography of Dunstable Downs. In this project, Smout Allen create markers in the landscape that they call “kites” – instruments that record the thermal movement as it rises from the plane. They describe the mechanism of these kites as being
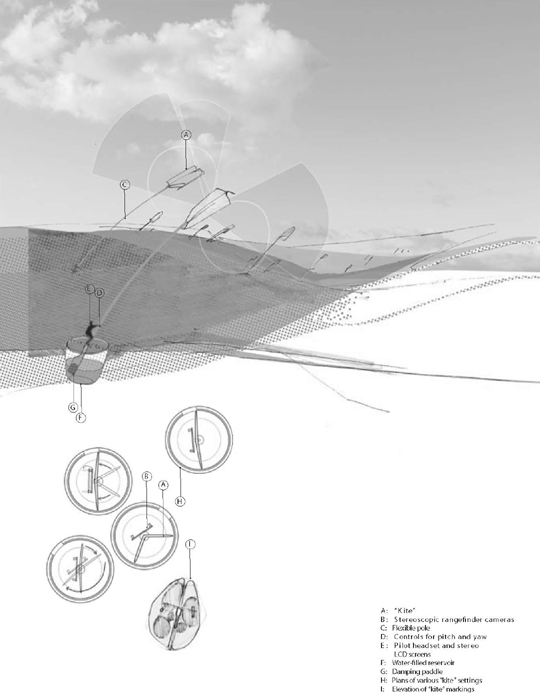
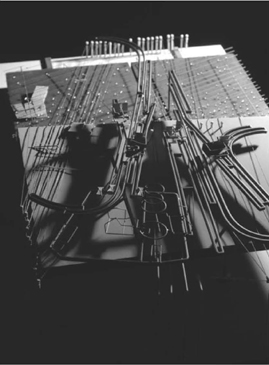
FIGURE 5.8 Dunstable Downs Kite Farm and plan diagrams of the “trimming of the sails” (courtesy Smout Allen)
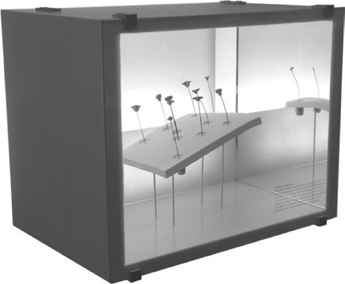
connected to the ground by a flexible pole. They are anchored to a pivoting base that is mounted in a water-filled reservoir to limit and slow movement. A pair of cameras mounted on each kite relays stereoscopic live images to the pilot’s viewpoint, providing a three-dimensional panorama from the perspective of the kite. As the horizon appears to hover and glide, the pilot achieves the sensation of flying.17
The kites thus create a live performative map of the environmental conditions that would have otherwise been invisible to the naked eye while at the same time can actually record and transmit this data to create a new map in terms of data gathering which can be translated in visual representation. While both these projects encompass quite substantial geographical areas, the architectural design itself has a light touch when it comes to the representations and in terms of the actual footprint of individual elements that I refer to as markers on the landscape. It is through the repetition of these that maximum impact is created and the landscape is controlled so to speak. Architecture here can be considered as devices that generate spatial mapping.
The manner in which both these projects are represented is quite revealing. There are key drawings with incisive architectural instruments within the landscape that have a pointed but light touch. The use of watercolor-like technique for the overview drawings lends a sense of ephemerality to the surrounding landscape. These drawings also give an overview of the architectural instruments in the panoramic landscape and their position with respect to the horizon. Nevertheless, a majority of drawings for each project are details of the architecture insertions that are technical in nature, very much in the vein of instruments, their construction, and their working. In that sense, they are very much in the vein of instructions of operation and thus allographic in nature. There is a kinetic aspect to these in that they focus on transformations of the instruments. Finally there are the models, which are framed by their careful placement within a box. The architects write that the Landmark boxes, specifically discussing the kites project, are backlit and mirrored “to indicate the panoramic gaze, reflected skies, and the repetition of elements of design.” A deliberate symmetry is created with the mirroring so that the repetition of elements that occurs is not random but in fact follows a symmetrical order. The establishment of this ordering can be considered as much of an artifice as the surveyor’s grid. The model within the mirrored glass-box also shows the ground plane lifted. The act of raising the ground place reveals the significance of the invisible. Here mapping, that plays such an important role in the design, is not just pertaining to the surface but to the hidden forces below the surface. What is especially telling is the manner in which these models are photographed – all published images show a three-quarter corner view. One would have to imagine that these models are meant to be observed at a level raised from the eyelevel to emphasize the multiplicity of reflections. The raising of the viewing level of the models undoubtedly emphasizes the lifting of the ground plane and the deliberate corner view ensures that only the instruments are reflected on the horizon giving a multiplier effect of an array of markers in the landscape.
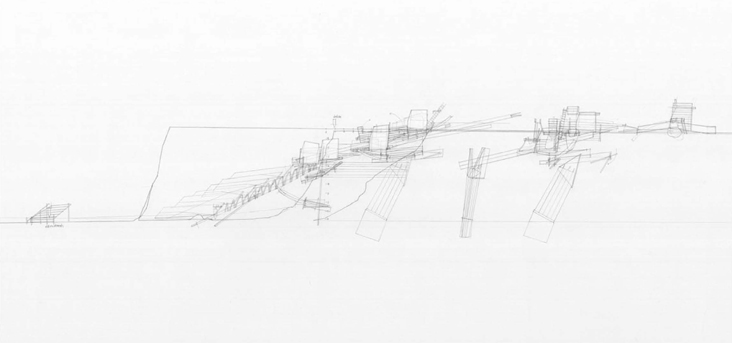
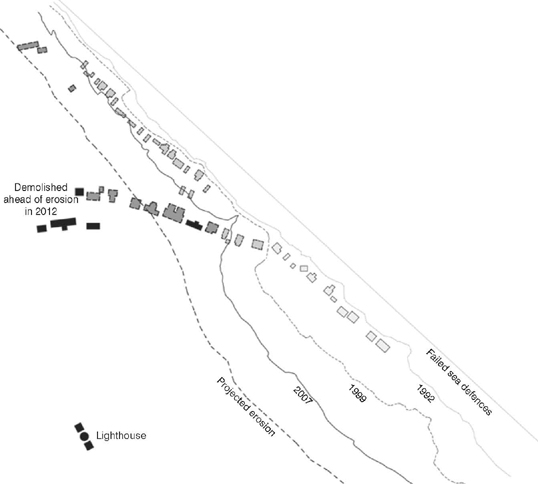
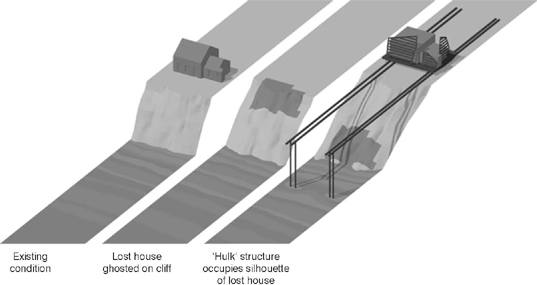
Mapping as an analytical tool for documentation as well as design generation is evident in Smout Allen’s “Retreating Village” project proposed for the village of Happisburgh on the North Norfolk coast which is gradually eroding with the rising sea levels. This scheme inhabits the disintegrating territory between the sea and what is now land but will be taken over gradually by the sea. The design works such that this village retreats as much as five meters each year by using an artificially created mechanical landscape of pulleys, rails, and other devices that support the new/transforming village and would be instrumental in its movement to safety. The predicted rise of the ocean is registered in the design of the artificial landscape and is apparent quite explicitly in the sectional drawings. Moreover, a careful scrutiny of the design drawings also reveals marks and meters that not only register but also trace the invisible fluctuating nature of the site, making them maps in their own right. The drawings and models of the village show trajectories and tracings of the settlements prior to disintegration. These mappings become significant markers for the proposed mechanical systems that determine properties and infrastructure. Along with registering the existing environment and the anticipated future, one also identifies a mapping of memories through the representation of ghost structures such as the houses in plan and section. Mapping then is a denotative device to register past, current, and connotative of projected future conditions.
The mechanical landscape that is created by various devices such as pulleys, counterweights, rails, and winches, gives rise to a new operational territory but also preserves existing territory. The design and engineering decisions are determined by the existing deteriorating site conditions and also creating a new map in the process in that the new kinetic landscape that is created by the artifice of the new infrastructural devices holds both the new and the existing settlement. This is an exercise in mapping not only as a design generator but also as an amplifier of memories in the ghosts of earlier forms that are registered through enclosing older and existing forms within the new design. Specific design devices used – faggots, beams and arcs, skids, props, and buoys – are instruments that help safeguard the existing landscape and create a new landscape. They thus become instruments that map landscape and register changes within it and at the same time are instrumental in the creation of the new map that also forms the new landscape. So, in a sense, Smout Allen’s work brings into focus architecture as an instrument of mapping that is both denotative of the existing but also connotative of the projected new.
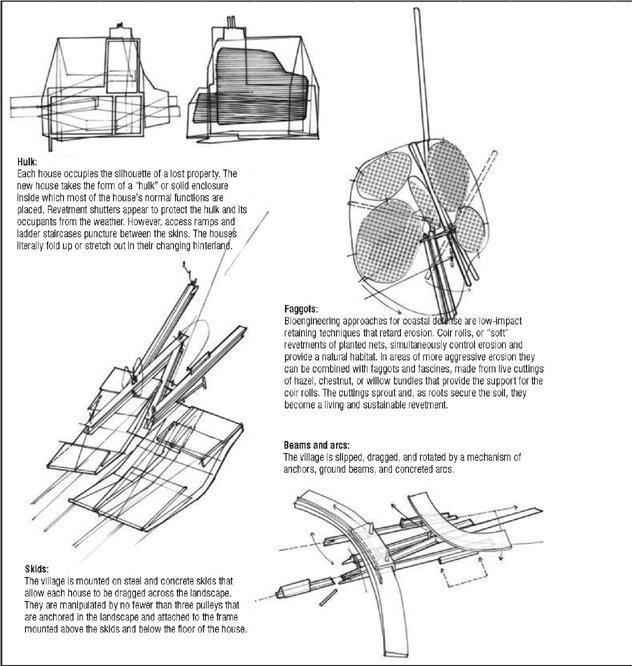
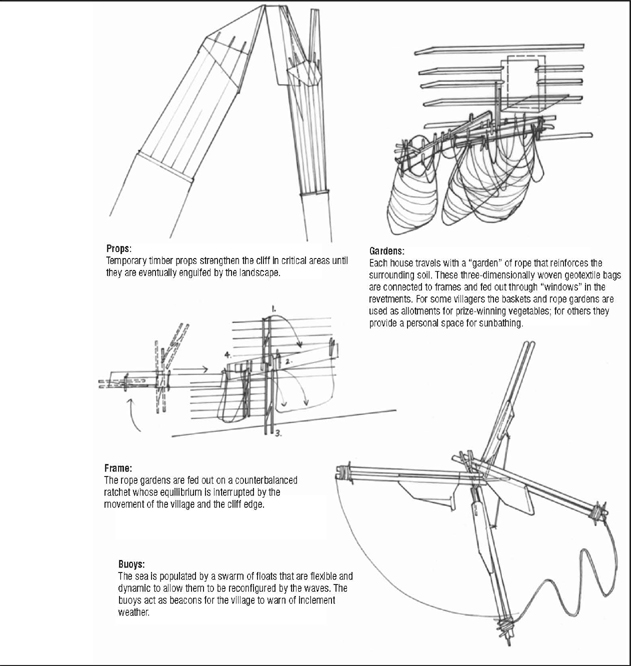
FIGURE 5.12 Mechanical devices that create and map the new landscape and built environment (courtesy Smout Allen)
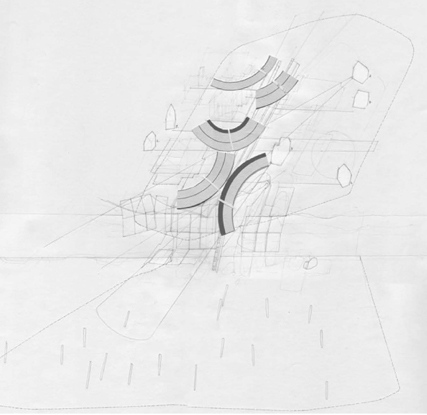
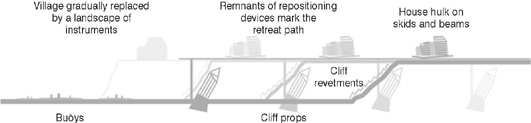
FIGURE 5.13 Beams, arcs and mattresses dominate the landscape; remnants remain of footings and paths that evoke the past life of Happisburgh (courtesy Smout Allen)
In these projects, representations, either drawings that show details or models that show both the details and an overview, focus on the kinetic nature of the architectural instrument and its performance. The kinetic nature of elements also contributes to the sense of impermanence within a constantly changing landscape. The architecture of all three Smout Allen projects does not impress upon the viewer an idea of permanence. On the contrary, there is a deliberate language of transformation and change in the way these projects are designed and expressed. Both Dunes and Drift and the Kite Farm have a light touch in the manner in which they are represented while the Retreating Village “adopts a language of impermanence, of permeable screens, loose-fit structures and cheap materials that complement and contribute to the nature of the restless landscape.”18 This constantly changing architecture and infrastructure, and in turn the map itself, is something that is reminiscent of Constant’s New Babylon’s continuously changing maps.
From Performative to Performance
From Performative to Performance
Lebbeus Woods’ collaboration with Christoph Kumpusch in the System Wien project,19 thought by some as a performance art piece, can in fact be seen as a shift from mapping that has more aspects of codification of information to a position where mapping is performance and performance is mapping. He takes invisible forces at play within the city of Vienna and visually concretizes these in drawings that can be considered as having their own internal codification but might seem opaque to the viewer, especially as a translations of information or data. These maps are then enacted within the city.
In this project, the spatial organization of Vienna is seen as “organized energy”, which is expressed as lines that the architects call vectors. An interesting choice of word in itself since it comes from the Latin vehere, which means “to carry” or “to convey”, it has an implicit idea of communication either directly or indirectly through social means whether it is a suggestion, gesture, behavior, or appearance. A form of mapping, these vectors are represented on drawings of the city as lines of force. These lines appear in photographs of the city as well, and later become instruments of performance. Woods discusses this performative aspect in terms of kinetic energy of the city:
The vectors not only express energy, they embody energy. Like other constructive elements used to build the city, they are elements of a system organizing the mechanical, cognitive and affective energy it took to make them, palpable energy that remains potential in their residual forms. If we can see vectors as forms of potential and kinetic energy, then we can see buildings that way, too, and the city itself. If we can see these things not simply as objects, but as embodied energy, then we can see ourselves and others not as material objects, but as living systems interacting continuously with other systems, both animate and inanimate.20
A series of collages by Woods are aimed to show what he describes as the “invisible forces” present in Vienna that the architect operates upon in drawings and that show propositions of activity which are eventually realized through performances within the cityscape. Dancers carrying props that represent vectors enact a live map in the city. The representations span from drawings and photographs of specific sectors in Vienna. These then go through transformations that express abstract vector drawings to photographs of the city and finally dancers within the city that are montaged onto street photographs with vectors and technical details of props that represent the vectors, thus enacting the abstractions of a map in space and reminding one of Lewis Carroll’s Sylvie and Bruno Concluded and Borges writing “On Exactitude in Science” quoted at the beginning of this chapter.
While operations that push boundaries of traditional mapping are significant in most works discussed in this chapter and constitute an important aspect of projection, it is most instrumental as generative tool in the design formulation. This is especially evident in the work of Constant and Kulpers. With Smout Allen’s work, architecture itself becomes a map and an instrument that creates the map, in that it becomes a device that registers, marks, and maps the landscape. While with Lebbeus Woods’ System Wien project the map is enacted and becomes a performance in itself within the urban environment.
Translations from physical phenomena, visible and invisible features in the landscape, to a representational mode of mapping undoubtedly involves abstraction, while translations of information and data to a visual mode of mapping adds an additional filter. The manner in which this is achieved, in other words the techniques of mapping, is therefore crucial. It is in the construction of “new realities” that particular graphic means have been employed, many of which tend to use notational systems developed over time. These systems of representation, however, erroneously give a semblance of “truthfulness,” “neutrality,” with the demonstration of technical and scientific knowledge that often obscure the many subjective decision-making tendencies. Nevertheless, how one chooses the data, frames it, and specific techniques of representation that are used to express it, in itself becomes the critical point of translation. There is already an element of a projection involved in how information is denoted thereby creating the initial space of representation. In fact, Corner quite fittingly puts it when he says, “…mappings do not represent geographies or ideas; rather they effect their actualization.”21 So while selection and framing of data is the first step of the translation process, how it is represented is crucial to the manner in which the problem is formulated, the brief developed for design generation to occur. The role of mapping techniques is important in how spatial meaning is generated, and it is in the projective capacities of the medium that design formulation occurs.
Nelson Goodman, when discussing notational systems in his book Languages of Art, writes about music being an allographic art allowing for notation at one end of the spectrum, and painting/sculpture being an autographic art, at the other end of the spectrum, concluding that “architecture is a mixed and transitional case.”22 And while Goodman is discussing the direct relationship with the art form, in the case of architecture this becomes especially murky with drawings being the main mode of production for the end product which is the building. Even within architectural drawing there are differences: construction drawings, on the one hand, are seen as a set of instructions, which can be replicated much like musical scripts and can be considered allographic in nature; nevertheless, on the other hand, conceptual drawings, such as those of Rossi for instance, while encoding ideas, are more akin to painting and autographic in nature. Keeping this in mind, one can argue that in mapping one tends to use a notational system that according to Goodman is disjointed, has finite differentiation or articulation,23 and, therefore, could be considered as a discrete system. This is especially true considering that data, which is classified, ordered, and abstract, as in many conventional maps. Nevertheless, the maps discussed in this chapter are not conventional in nature and have the generative capability. These maps fall towards the spectrum of dense systems especially when one considers those that use montage and collage techniques. These are more analogous to the manner in which Goodman discusses paintings and sculpture, the autographic arts. In the examples discussed, the density of visual information that collapses space is in fact more instrumental in a generative sense. At least in the cases that are disscussed in this chapter we can assert that dense systems that are autographic in nature are the ones that are more generative and allow for multiple readings, in a sense, much closer to Deleuze and Guattari’s dictum that “a map has multiple entryways.”24 Allographic schemas that use notational systems can be replicated and are wonderful tools of articulation, communication, and clarification, but are not necessarily conducive to the development of design briefs and therefore are not necessarily generative, at least when considered with respect to the cases referred to in this chapter. When it comes to generative notions, it is invariably a combination of multiple attributes that amalgamate to create a dense autographic schema that is important to design formulation.
Mapping as a representational tool absorbs the local and circumstantial conditions, which form an important process from which emergent properties create patterns of relationships and formal structures thereby making the process an important design generator. There is an aspect of displacement and transfer that occurs with representations that were discussed in this chapter. Bruno Latour, in his discussion of immutable mobility, equates this to the metaphorical ability that recombination, reshuffling, and superimpositions allow us to achieve:
… since these inscriptions are mobile, flat, reproducible, still and of varying scales, they can be reshuffled and recombined. Most of what we impute to connections in the mind may be explained by this reshuffling of inscriptions that all have the same “optical consistency.” The same is true of what we call “metaphor.” One aspect of these recombinations is that it is possible to superimpose several images of totally different origins and scales.25
The relational patterns therefore have this metaphorical ability that translates to their generative capability. In that these maps have a projective capacity to “construct something that is yet to come,” they are similar to Deleuze’s diagrammatic or abstract machine.26
Notes
1 Nelson Goodman, Languages of Art (Indiana: Hackett, 1976) p. 218.
2 James Corner, “The Agency of Mapping” in Denis Cosgrove edited Mappings (London: Reaktion, 1999), p. 216.
3 Mark Wigley, “Paper, Scissors, Blur” in Catherine de Zegher and Mark Wigley edited The Activist Drawing: Retracing Situationist Architectures from constant’s New Babylond and Beyond (Cambridge, NY, London: The Drawing Center & MIT Press, 2001), p. 37.
4 Wigley, “Paper, Scissors, Blur,” p. 33.
5 Catherine de Zegher, “Introduction” in Catherine de Zegher and Mark Wigley edited The Activist Drawing: Retracing Situationist Architectures from constant’s New Babylond and Beyond (Cambridge, NY, London: The Drawing Center & MIT Press, 2001), p. 10.
6 Wigley, “Paper, Scissors, Blur,” p. 50.
7 Corner, The Agency of Mapping, p. 245.
8 Corner, The Agency of Mapping, p. 249.
9 Corner, The Agency of Mapping, p. 231. Here he is using Deleuze and Guattari’s discussion of rhizomatic mapping.
10 Michael Baxandall, Patterns of Intention: On the Historical Explanation of Pictures (Yale University Press: New Haven, 1985), p. 44.
11 Perry Kulper, “Representing beyond the surface” Arc CA Drawn Out, AIACC Design Awards Issue, 05.3, p. 19.
12 In the short description of this project Perry Kulper specifically discusses analogical references that are an inspiration for design such as Japanese kosode, dioramas, and operating theaters. He also writes about “metaphorical potential of varied mythological accounts” that are linked to the cultural roots of museums and to the agricultural region where Fresno is located.
13 In an email describing this project.
14 Kulper, “Representing beyond the surface,” p. 18.
15 Mark Smout, “Out of the Phase: Making an Approach to Architecture and Landscape” in Architecture Design 78, issue 4, 2008, pp. 80–85.
16 Smout Allen, Augmented Landscape, Pamplet Architecture 26 (Princeton: Princeton Architecture Press, 2007), p. 26–29.
17 Smout Allen, Augmented Landscape, p. 35.
18 Laura Allen and Mark Smout, “Restless landscapes” conference paper “In the Making” (Copenhagen: Interactive Institute/Nordes catalogue & internet publication, 2005), pp. 1–5.
19 Lebbeus Woods, System Wien, edited by Peter Noever (Ostfildern-Ruit: Hatje Cantz; New York: D.A.P., 2005).
20 Lebbeus Woods writes about this in his blog: http://lebbeuswoods.wordpress.com/2009/06/05/architecture-of-energy/ Accessed on December 27, 2013.
21 James Corner, “The Agency of Mapping” in Mappings, p. 225.
22 Goodman, Languages of Art, p. 221.
23 I’m using notational system following Nelson Goodman in Languages of Art and while pictorial systems in his opinion fail on syntactic and semantic ground to be true notational systems, I’m expanding his idea to make a distinction between traditional mapping techniques and the more experimental ones that I have discussed in this chapter. While all types of mapping techniques discussed here would fall in the realm of dense systems and would necessarily be autographic in the Goodmanian sense, I’m trying to differentiate between them to clarify what I think are modes that are instrumental in generative design.
24 Gilles Deleuze & Felix Guattari, A Thousand Plateaus, translated by Brian Massumi (Minneapolis: University of Minnesota Press, 1987), pp. 12–13.
25 Bruno Latour, “Visualization and Cognition: Drawing Things Together,” in H. Kuklick edited Knowledge and Society Studies in the Sociology of Culture Past and Present, Jai Press, volume 6, pp. 19–20.
26 Deleuze & Guattari, A Thousand Plateaus, p. 142.