USING SCIENTIFIC RESEARCH METHODS IN ASSESSING VISUAL AESTHETIC QUALITY
Introduction
When architectural critics, as they often do, report their opinion of the “artistic” merit of a building, they miss people’s experience with buildings. In contrast, a scientific approach gauges the feelings of occupants and passersby about the appearance of places. These evaluative appraisals (emotional responses and meanings) affect behavior and function. The present chapter describes how to measure such evaluative appraisals. Referring to the research and theory in environmental psychology and related disciplines, it evaluates the options and demonstrates two visual quality programming projects, one done for a city and the other done for the new headquarters for the New York Times. Designers, planners, and communities can use the existing knowledge on how characteristics of the environment affect emotional response and meanings, or for specific projects and purposes, they can use the assessment methods to create visual quality guidelines.
Background
Design researchers have discovered physical and perceived characteristics of environments that affect human evaluations, such as preference and behavior (Kaplan and Kaplan 1989; Nasar 1994). For example, people tend to walk more in an area they perceive as safe or pleasant (Miles and Panton 2006). Although individuals may differ, plans for visual quality should seek for shared meanings or preferences. Such plans would create places that convey relevant meanings. This involves crafting design guidelines for appearance to satisfy emotional and meaning goals such as appearing pleasant or safe.
Planners can assess places for meanings by having people rate and evaluate various qualities of those places. The physical and the perceived characteristics of environments are likely to provide complementary information about the influence of environments on perception, meaning, and behavioral outcomes. But it is the perceptions that matter most.
Environmental assessments that differ in terms of various individual characteristics may provide clues about guidelines for various groups. Identifying environmental characteristics that most people evaluate favorably and that relate to desired behavior can offer clear guidelines for design. For this, one must have appropriate measures of perceptions and evaluations and appropriate study designs.
For guiding visual quality, this chapter covers: (1) the link between environmental perception, meaning, and function, (2) methods for measuring perceptions, and (3) what to measure in the environment. Characteristics of the physical environment interact with various human characteristics to affect the individual’s reaction to the environment. Those reactions affect evaluations and meanings, which affect behavior. This chapter focuses on vision, the dominant sense for humans.
Regarding perception, evaluation, and function, appearances have powerful effects on people. Humans have rapid emotional responses to places (Zajonc 1984). “Aesthetics” (visual appeal) dominates people’s experience of their surroundings (Nasar 1994; Rapoport 1990) and behaviors (Duncan and Mummery 2005; Humpel et al. 2004). People are more likely to visit places they judge as pleasant, and avoid places they judge as unpleasant. Studies on aesthetics operationalize it as favorable evaluations and inferences about the quality of the environment and users (Nasar 1994). People are more likely to walk in environments they perceive as safe (Ball et al. 2001; Miles and Panton 2006; Nasar and Fisher 1993).
Some physical measures of the environment do not translate into people’s perceptions of the environment, which ultimately affect their behavior. Thus, we must gauge perception, and in particular those environmental characteristics that stand out in people’s perception.
Methods to assess visual quality
To measure environmental perception, meaning, and visual quality, the planner must consider four issues: (1) characteristics of the environment, (2) environmental stimuli, (3) response measures, and (4) respondents. The following sections describe and evaluate these choices for practicality, establishing cause, and applicability of the findings to other conditions.
Selecting and measuring characteristics of the environment
One can obtain physical measures of concrete characteristics of the environment such as room height. However, many characteristics of relevance to perception, evaluation, and behavior involve a more abstract perceived integration of characteristics. Thus, we must use human observers to assess abstract characteristics of the environment (such as naturalness or order) that affect human evaluations and behavior. For design, it helps to know how well a physical measure matches people’s perception of it to know whether a specific manipulation works as intended.
Thus, studies might use both physical and perceptual measures. For example, Nasar and Fisher (1993) linked physical measures to perceptual measures to behavior. Although perceptual measures appear subjective, they tend to be consistent and accurate measures of environmental characteristics (Ewing et al. 2006). Fifteen raters should be adequate to get the needed reliability.
There is also strong consensus across people in evaluations of places. A review covering 40 studies, 1,001 environments, 5,301 respondents from 432 samples, 21 countries, and 13 demographic groups found strong consensus (except for designers and the public) across a host of socio-demographic groups (Stamps III 1999). Other research indicates that variation in evaluation depends more on characteristics of the environment than on differences among people (Stamps III 2000).
To find the relationship of perceived characteristics of the environment to the evaluation of them, one must obtain independent measures of the two kinds of variables. If the same person rates both kinds of variables, the ratings might affect one another, biasing the results. Thus, for example, a study of the desirability of physical characteristics of an office should use two groups, one to assess those characteristics and another to assess the desirability of the offices.
Ratings from occupants after a change in their environment may have a bias either from an implicit comparison to the previous conditions or from the occupants’ knowledge of investment to make it better. To rule out these potential artifacts and find the cause, controlled walkthrough simulations, discussed later, offer one technique to establish the likely responses and behavior.
Selection and presentation of environmental stimuli
Investigators must decide how to sample the environment and must choose the mode of presentation of the selected environment.
Sampling the environment
For a visual quality plan, the programmer needs to obtain information on the effects of certain characteristics of places in a way that generalizes to real conditions. The programmer could systematically manipulate scenes along characteristics of interest. For example, one study created nine signscapes that varied in the physical complexity and obtrusiveness of the signs (Nasar 1987). Ratings by a panel of judges confirmed that the signscapes varied as expected on perceived complexity and obtrusiveness; and the study subsequently obtained evaluative responses to the various options.
People familiar with an environment may, influenced by personal feelings, judge its characteristics and evaluate it differently from others unfamiliar with it. Familiarity can color their judgment of its physical characteristics. Using a panel unfamiliar with the environment can mitigate those potential biases.
The programmer could also select real environments that vary according to the characteristics of interest. While this can yield a more realistic sample, it may do so by sacrificing control. Other naturally occurring characteristics may co-vary, leaving cause uncertain. For example, if one selected environments that varied in naturalness, they might also tend to vary in density, openness, upkeep, or some other characteristic that would affect evaluations. Pre-selection may also overlook characteristics relevant to ordinary experience. To avoid this problem, the investigator could select characteristics previously identified as salient in people’s perception of the environment (Figure 19.1).
One could sample a variety of environments relevant to the kind of environment of interest, without attempting any control – although one should control the presentation of the environments to reduce bias from photographic quality and viewing angle. This approach could have strong generality, but the presence of so many characteristics makes it difficult to establish cause. The use of multiple methods, each with unique biases, can allow for triangulation of convergent and divergent validity tests on the results.
FIGURE 19.1 Salient physical characteristics of environments
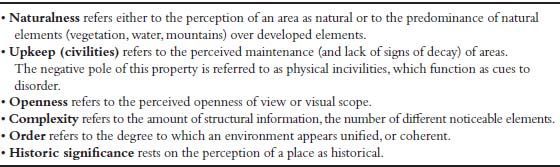
Source: author.
Mode of presentation
The dilemma of the choice between internal and external validity can be alleviated through choosing an appropriate mode of presentation (Table 19.1).
TABLE 19.1 Strengths and weakness of various modes of presentation
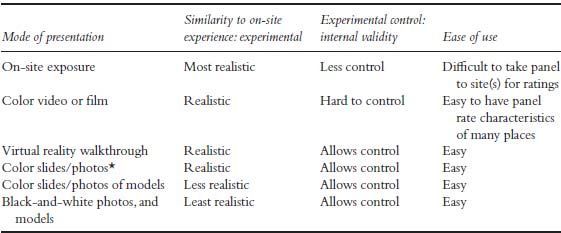
* Computer manipulations of color photos and virtual reality environments can yield realistic controlled images.
Source: author.
The investigator can overcome the trouble of taking each participant to sites by using color slides or virtual reality simulations. The computer allows one to easily manipulate characteristics for testing; and responses to color slides or photos accurately reflect on-site experience, more accurately than responses to drawings or black-and-white photos (Kaplan and Kaplan 1989; Stamps 1993). Responses may differ with movement (Heft and Nasar 2000; Rapoport and Hawkes 1970). Computer-generated virtual walkthrough environments allow both experimental control and movement, and behavior in virtual environments generalizes well to behavior in actual environments (Nasar and Cubukcu 2005).
Response measures
Many studies use verbal rating scales without efforts to deal with response biases and the reactivity inherent in them (Adair 1973; Hoyle et al. 2002; Webb et al. 1966). To record environmental perceptions and evaluations, research needs such verbal ratings, but these can be supplemented with physiological and behavioral measures. For evaluative appraisals (such as preference), reliance on verbal measures alone may identify cold cognitions that lack emotional involvement (Lazarus 1980). Behavioral and physiological measures may help establish the level of involvement. One can also craft verbal measures to indirectly tap likely behavior or physiological response by asking about expected behavior or feelings in realistic situations. For example, a study of house exteriors had respondents imagine winning a dream-house lottery and then selecting the house they wanted (Nasar 1989); a study of commercial strips asked respondents to indicate which they would most likely visit to shop (Nasar 1987). Other research has developed a verbal measure that is consistent with physiological measures of restorativeness (Hartig et al. 1997).
TABLE 19.2 Items for use in assessing salient aspects of emotional appraisals
Response category | Items |
Pleasantness | Appealing – unappealing |
Attractive – unattractive | |
Beautiful – ugly | |
Pleasant – unpleasant | |
Inviting – repelling | |
Excitement | Unexciting – exciting |
Lively – dull | |
Unstimulating – stimulating | |
Interesting – uninteresting | |
Relaxation | Unexciting – exciting |
Upsetting – calming | |
Refreshing – wearying | |
Restful – disturbing | |
Threatening – safe | |
Distracting – soothing |
Source: author.
One can administer verbal measures to large numbers of people, allowing the quick evaluation of many environments. Psychological texts on measurement offer more detail on the use of such measures (Hoyle et al., 2002).
What to measure
In planning the visual quality of place, we need to assess the characteristics that people notice. The following paragraphs briefly summarize key characteristics of places of relevance for environmental perception, evaluation, and behavior (Kaplan and Kaplan 1989; Nasar 1994, 1998).
Emotional responses in relation to the environment include affective appraisals and emotional reactions (Posner et al. 2005; Russell et al. 1989). Affective appraisal refers to the emotional quality and inferences attributed to an environment, such as liking it or judging people in it as friendly. An emotional reaction refers to an internal state (such as pleasure) that a person feels. For design, affective appraisals probably have more relevance. Affective appraisals have three key dimensions: pleasantness, excitement, and relaxation (Posner et al. 2005; Russell et al. 1989). Table 19.2 shows items from tested lexicons of environmental descriptors (Kasmar 1970; Nasar 1988a, 1988b) that can be used to construct scales for pleasantness, excitement, or relaxation.
For evaluating places, the assessment should tap into users (individuals likely to experience the places under consideration). In some cases, such as a school, one can assemble a list of the population. Then the investigator should use a census (for a small population), or a random, stratified, or cluster sample to obtain a sample representative of the population. For new or proposed projects, the investigator could identify passersby, occasional visitors, and surrogates for them. Then, the investigator could use a census for a small population, or a probability or non-probability sampling procedure to select respondents from the population.
Although a random, stratified, or cluster sample is desirable, in many cases an opportunity sample makes sense. For example, it makes sense for finding out how passersby evaluate the exterior of a building. To avoid potential biases in selection, use a systematic sampling procedure, with decision rules about selection days, times, and people.
Examples of visual quality programs
Research shows some consistent patterns in environmental preferences (for reviews, see Kaplan and Kaplan 1989; Nasar 1994). People like environments perceived as natural, orderly, historical, and having good upkeep, open views, and moderate complexity, and novelty or atypicality. For projects seeking a pleasant appearance, one can use these characteristics. For other appearance goals, such as excitement, other characteristics would apply. From a practical perspective, for specific projects it makes sense to consult people about the visual quality goals and the design features to achieve goals. Consider two examples.
Programming the evaluative image of a city
In planning for the Knoxville International Exposition, we developed criteria for improving city appearance (Nasar 1998). We let the respondents define the visual characteristics they liked and disliked. They responded to their mental image of the city. We had each participant identify up to five areas they liked visually and five areas they disliked visually, give boundaries for each, and name the physical features that accounted for their responses, and we had them select from a list of physical elements the ones in need of improvement. Because the city was concerned about resident and visitor impressions, we sampled each group. For residents, we obtained a random sample (N = 160) through random digit dialing. Because we could not get a random sample of visitors, we sampled them (N = 120) by selecting hotels and motels at random from six zones of the city and approaching people in those places. Residents responded verbally and the interviewer mapped their responses. Visitors marked their responses on a map. To analyze the results, we overlaid the maps (today one could use GIS) to create a shared evaluative map for residents and visitors separately of the most frequently liked or disliked areas and the most frequently cited reasons (Figures 19.2 and 19.3). The visual quality program showed areas having positive images, areas needing improvement, and what was needed to improve the image of the disliked areas. Based on the analysis, the guidelines to improve the evaluative image called for policies to improve the character of the undesirable areas by adding the desirable elements.

FIGURE 19.2 Evaluative map of Knoxville by residents
Source: author.
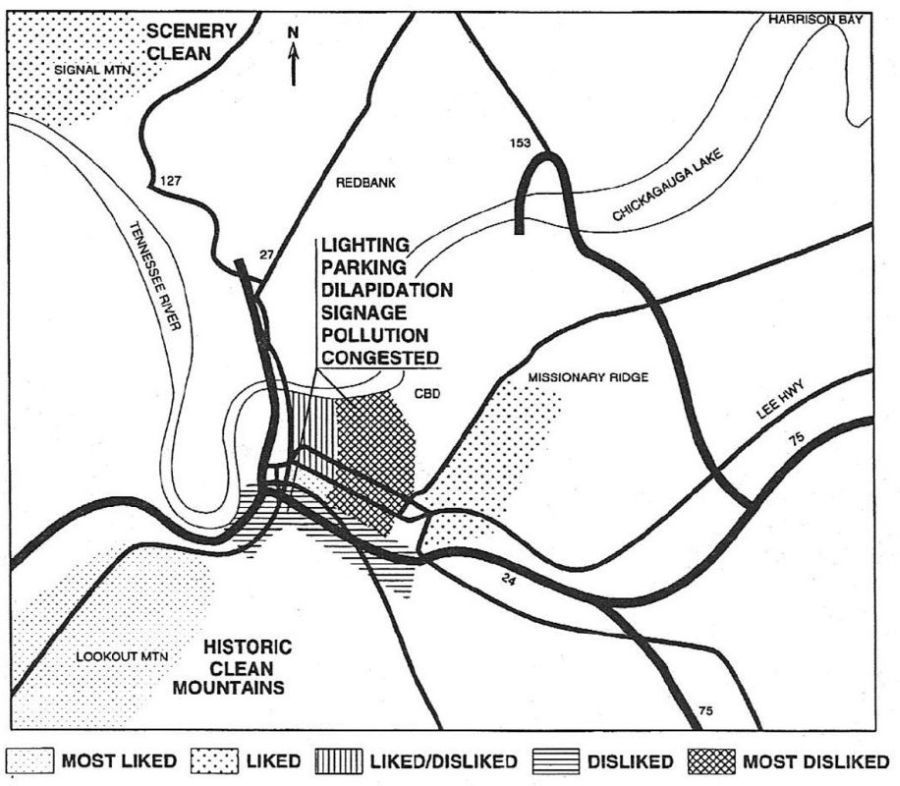
FIGURE 19.3 Evaluative map of Chattanooga by visitors
Source: author.
Creating guidelines for the appearance of the new headquarters for the New York Times
For the New York Times headquarters I had to discover the meanings the new facility should convey. For this, I assembled a list of adjectives (both positive and negative) that might apply and checked the list with representatives from the Times to get a final list (Figure 19.4). For stimuli, I used color photographs of a diverse set of nine buildings (the height of the planned building). I obtained four kinds of responses. On the adjective list, participants checked those words that best described the image the new facility should convey. I had them sort the buildings from the one most like what the new headquarters should look like to the one least like what it should look like. I had them describe the liked physical characteristics of their most preferred buildings, and the disliked physical characteristics of the least liked buildings. The Times limited my sample to employees. To get that sample (N = 212), I set up a table at the main entrance during the peak morning, afternoon, and evening hours and stopped passersby for interviews. The analysis tallied the frequency they picked each adjective, the rank scores for each building, and the frequencies with which participants mentioned building qualities as liked or disliked. The appearance guidelines specified the meanings most participants cited for the new headquarters to convey, the desired qualities (with examples of most liked building), and the undesirable qualities (with examples of least liked buildings). It also showed the overall building ranks, and the reasons given for the most liked and least liked buildings. After the building was built, one could conduct a post-occupancy assessment of the meanings the completed building conveys to passersby.
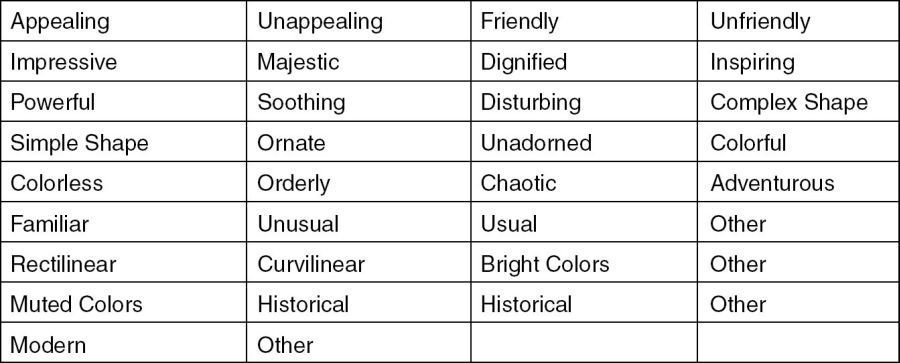
FIGURE 19.4 Adjective checklist for qualities the new headquarters should convey
Source: author.
Conclusion
Assessing perceptions of environmental characteristics and affective appraisals of environments has relevance to programming and evaluating places. With appropriate choices of environmental stimuli, measures, and respondents, one can create solid visual quality guidelines for design. For specific projects, one can develop visual quality guidelines by determining the visual qualities desired for the particular project, context, and populations. For this, the design programmer should investigate, develop, gather, and organize information to produce design guidelines that support the visual quality goals for the facility. Recognizing the connection between function and appearance, visual quality programming creates guidelines within which the design should operate.
This consumer-oriented approach involves people in decisions that affect them. Scientific tests of this approach have found that public appraisals of likely meanings of designs accurately fit the actual meanings conveyed by the designs. The resulting visual quality program can both answer immediate questions about visual quality and feed into a database to help answer future questions. Ultimately, it yields environments that people enjoy.
Acknowledgments
This chapter was adapted from J. L. Nasar, “Assessing Perceptions of Environments for Active Living.” American Journal of Preventive Medicine 34 (2008): 357–63.
References
Adair, J. G. (1973) The Human Subject: The Social Psychology of the Psychological Experiment. Boston: Little, Brown.
Ball, K., A. Bauman, E. Leslie, and N. Owen (2001) “Perceived Environmental Aesthetics and Convenience and Company are Associated with Walking for Exercise among Australian Adults.” Preventive Medicine 33(5): 434–40.
Duncan, M. and K. Mummery (2005) “Psychosocial and Environmental Factors Associated with Physical Activity among City Dwellers in Regional Queensland.” Preventive Medicine 40(4): 363–72.
Ewing, R., S. Handy, R. C. Brownson, O. Clement, and E. Wilson (2006) “Identifying and Measuring Urban Design Qualities Related to Walkability.” Journal of Physical Activity and Health Suppl. 1: S223–S240.
Hartig, T., K. Korpela, G. W. Evans, and T. Garling (1997) “A Measure of Restorative Quality of Environments.” Scandinavian Housing and Planning Journal 14(4): 175–94.
Heft, H. and J. L. Nasar (2000) “Evaluating Environmental Scenes Using Dynamic versus Static Displays.” Environment and Behavior 32(3): 301–22.
Hoyle, R. H., M. J. Harris, and C. M. Judd (2002) Research Methods in Social Relations, 7th edn. Fort Worth, TX: Wadsworth.
Humpel, N., N. Owen, D. Iverson, E. Leslie, and A. Bauman (2004) “Perceived Environment Attributes, Residential Location, and Walking for Particular Purposes.” American Journal of Preventive Medicine 26(2): 119–25.
Kaplan, R. and S. Kaplan (1989) The Experience of Nature. New York: Cambridge University Press.
Kasmar, J. V. (1970) “Development of a Usable Lexicon of Environmental Descriptors.” Environment and Behavior 2(2): 153–69.
Lazarus, R. S. (1980) “On the Primacy of Cognition.” American Psychologist 39(2): 124–29.
Miles, R. and L. Panton (2006) “The Influence of the Perceived Quality of Community Environments on Low-Income Women’s Efforts to Walk More.” Journal of Community Health 31(5): 379–92.
Nasar, J. L. (1987) “Effects of Signscape Complexity and Coherence on the Perceived Visual Quality of Retail Scenes.” Journal of the American Planning Association 53: 499–509.
Nasar, J. L. (1988a) “Editor’s Introduction.” In J. L. Nasar (ed.), Environmental Aesthetics: Theory, Research, and Applications. Cambridge: Cambridge Cambridge University Press, p. 258.
Nasar, J. L. (1988b) “Urban Scenes: Editor’s Introduction.” In J. L. Nasar (ed.), Environmental Aesthetics: Theory, Research and Applications. Cambridge: Cambridge University Press, pp. 257–59.
Nasar, J. L. (1989) “Symbolic Meanings of House Styles.” Environment and Behavior 21(3): 235–57.
Nasar, J. L. (1994) “Urban Design Aesthetics: The Evaluative Qualities of Building Exteriors.” Environment and Behavior 26(3): 377–401.
Nasar, J. L. (1998) The Evaluative Image of the City. Thousand Oaks, CA: Sage.
Nasar, J. L. and B. Fisher (1993) “Hot-Spots of Fear and Crime: A Multimethod Investigation.” Journal of Environmental Psychology 13(3): 187–206.
Posner, J., J. A. Russell, and B. S. Peterson (2005) “The Circumplex Model of Affect: An Integrative Approach to Affective Neuroscience, Cognitive Development, and Psychopathology.” Development and Psychopathology 17(3): 715–34.
Rapoport, A. (1990) The Meaning of the Built Environment: A Non-Verbal Communication Approach. Tucson, AZ: University of Arizona Press.
Rapoport, A. and R. Hawkes (1970) “The Perception of Urban Complexity.” Journal of the American Institute of Planners 36(2): 106–11.
Russell, J. A., M. Lewicka, and T. Nitt (1989) “A Cross-Cultural Study of the Circumplex Model of Affect.” Journal of Personality and Social Psychology 57(5): 848–56.
Stamps III, A. E. (1993) “Simulation Effects on Environmental Preference.” Journal of Environmental Management 38(2): 115–32.
Stamps III, A. E. (1999) “Demographic Effects in Environmental Aesthetics: A Meta-Analysis.” Journal of Planning Literature 14(2): 155–75.
Stamps III, A. E. (2000) Psychology and the Aesthetics of the Built Environment. Norwell, MA: Kluwer Academic.
Webb, E. J., D. T. Campbell, R. Schwartz, and D. Sechrest (1966) Unobtrusive Measures: Non-Reactive Research in the Social Sciences. Chicago: Rand McNally.
Zajonc, R. B. (1984) “On the Primacy of Affect.” American Psychologist 39(2): 117–23.