Victor Olgyay, in his book Design With Climate (1963), lays out a clear analytic procedure to guide the decisions necessary to create comfortable and energy efficient houses. The procedure begins with information about the range of temperature that humans consider comfortable.
This is followed by a discussion of heat gains and losses. People gain heat from metabolism, through conduction and convection, through their skin from the air temperature, and from everything around them that is warmer than their skin radiating energy toward them. People lose heat by conduction and convection through their skin to the air temperature, to all the materials that surround them that are cooler than their skin radiating energy away from them, and by evaporation of moisture off of their skin. Comfort ranges for various groups of people versus effective temperature can be experimentally determined (Figure 12.1). The effective temperature is calculated using a complicated equation that includes air temperature, humidity, mean radiant temperature, and air motion (Olgyay 1963, 14–18).
Victor Olgyay combined the information contained in the effective temperature into a chart of temperature versus humidity with overlays for mean radiant temperature, air speed, and added moisture in the air. He called the chart the bioclimatic chart (Figure 12.2). The bioclimatic chart transforms a complex equation for the effective temperature into an easy to read chart (Olgyay 1963, 19–22).
The cigar shaped area in the center of the bioclimatic chart represents the comfort range where most people would be thermally comfortable in the shade with light clothes on. This comfort range is roughly between 70 and 80 degrees Fahrenheit, and from about 20 to 75 percent relative humidity. If the air temperature is below this range an increase in the mean radiant temperature will provide the sensation of thermal comfort. If the air temperature is above the comfort range an addition of air motion can cause a cooling sensation by evaporating moisture off a person’s skin. If the air temperature is above the comfort range and the humidity is very low, the addition of moisture into the air can actually lower the air temperature at the expense of raising the relative humidity. Note that the comfortable temperature range gets narrower as the humidity level rises from 50 to 80 percent. This happens because, as humidity increases, it is more difficult for people to cool their skin via the evaporation of sweat.
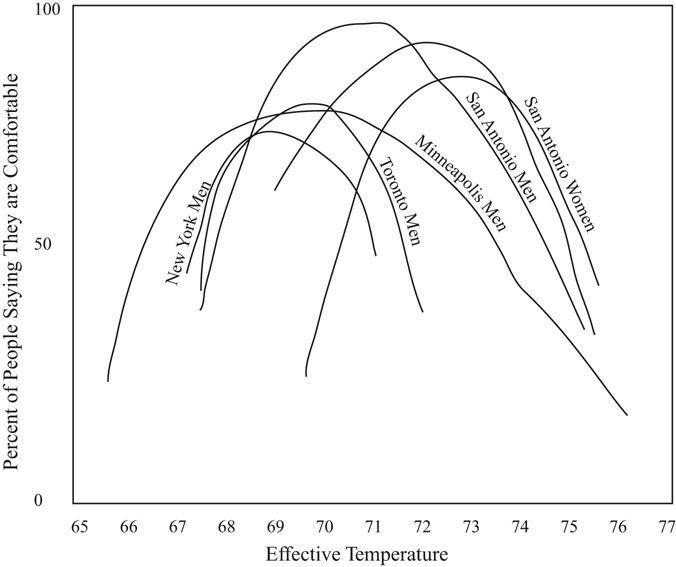
FIGURE 12.1 Effective temperature comfort ranges for men and women in different cities demonstrates that there is a range of comfortable temperatures.
Source: Olgyay, Victor. Design With Climate. Copyright 1963: Princeton University Press. 1991 renewed PUP. Reprinted by permission of Princeton University Press.
Brown and DeKay in their book Sun, Wind, and Light (2001) provide a version of the bioclimatic chart that relates areas of the bioclimatic chart to passive solar strategies for heating and cooling a building. This form of the bioclimatic chart is easier to use in a design environment (Brown and Dekay 2001, 54–55).
The National Oceanic and Atmospheric Administration (NOAA) measures and publishes weather data for numerous locations around the United States. Using the monthly maximum and minimum temperature and the maximum and minimum relative humidity, the local weather conditions can be plotted on the bioclimatic chart. To do this it is necessary to understand the relationship between temperature and humidity on a typical day.
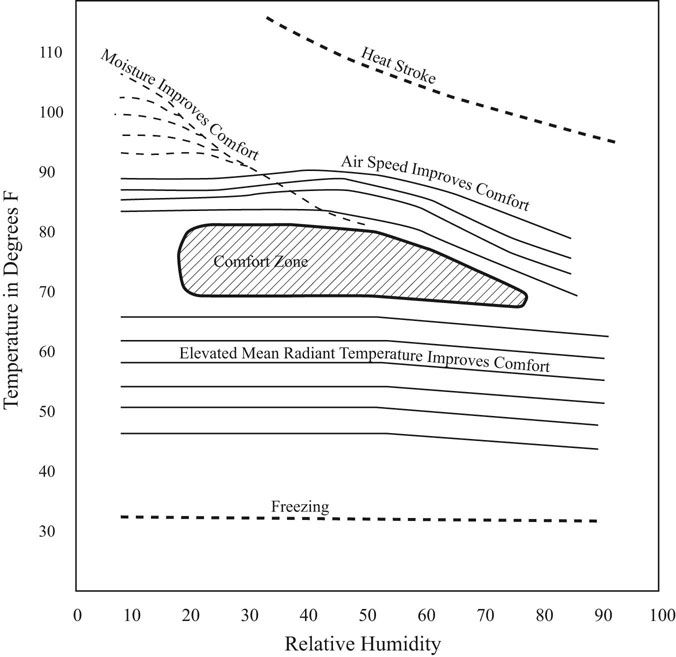
FIGURE 12.2 The bioclimatic chart maps human comfort in relation to temperature, humidity, mean radiant temperature, and wind speed.
Source: Olgyay, Victor. Design With Climate. Copyright 1963: Princeton University Press. 1991 renewed PUP. Reprinted by permission of Princeton University Press.
The average high temperature for a month is plotted with the average low relative humidity. The average low temperature for the month is plotted with the average high relative humidity. A line drawn between these two points is a good representation of how the temperature and humidity fluctuate through an average day for that month. Where the lines sit on the bioclimatic chart then provide design guidance. Thus, the bioclimatic chart provides useful design information from otherwise abstract weather data numbers.
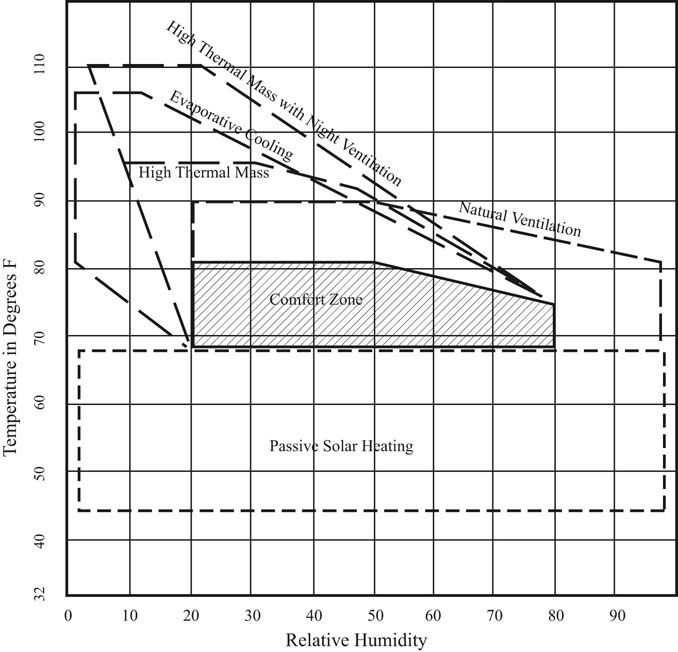
FIGURE 12.3 The bioclimatic chart from Sun, Wind, and Light (2001) maps the comfort range in relationship to architectural approaches to comfort design.
Source: Brown and DeKay 2001.
Plotting Baltimore’s weather on the bioclimatic plot indicates a climate that is warm and humid in the summer, comfortable in the spring and fall, and cold but not overly so in the winter (Table 12.1 and Figure 12.4). Comfort conditions can be extended in the summer through ventilation cooling, and can be extended in the winter with passive solar heating.
The plot for Tucson, Arizona, (Figure 12.5) shows a mild winter with low temperatures in the 40s and high temperatures in the 60s. The winter months all plot in the area of the chart that indicates the relatively easy use of passive solar heating. The summer months indicate hot dry conditions where a combination of evaporative cooling and night ventilation cooling will be necessary. In contrast, Burlington, Vermont, is dominated by its cold winter with a summer primarily in the comfort zone (Figure 12.6).
TABLE 12.1 Baltimore, Maryland, temperature (°F) and relative humidity
T (max) | T (min) | RH (max) | RH (min) | |
Jan | 41 | 24 | 71 | 57 |
Mar | 53 | 33 | 71 | 50 |
May | 74 | 52 | 77 | 52 |
Jul | 87 | 66 | 80 | 53 |
Aug | 85 | 65 | 84 | 55 |
Sep | 79 | 59 | 85 | 55 |
Nov | 56 | 37 | 78 | 55 |
Source: National Oceanic and Atmospheric Administration, National Climate Data Center. www.ncdc.noaa.gov.
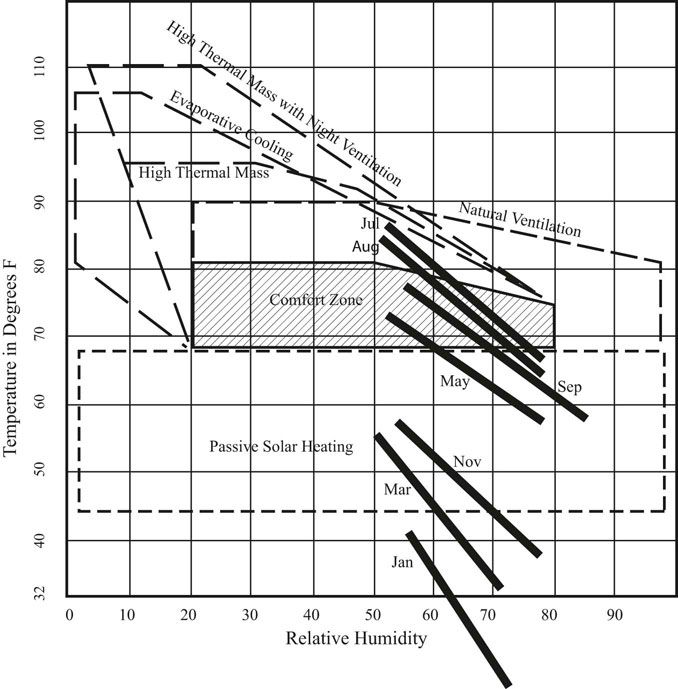
FIGURE 12.4 Baltimore, Maryland, weather data plotted on the bioclimatic chart.
Source: Bioclimatic chart, Brown and DeKay 2001. Climate plot, Carl Bovill.
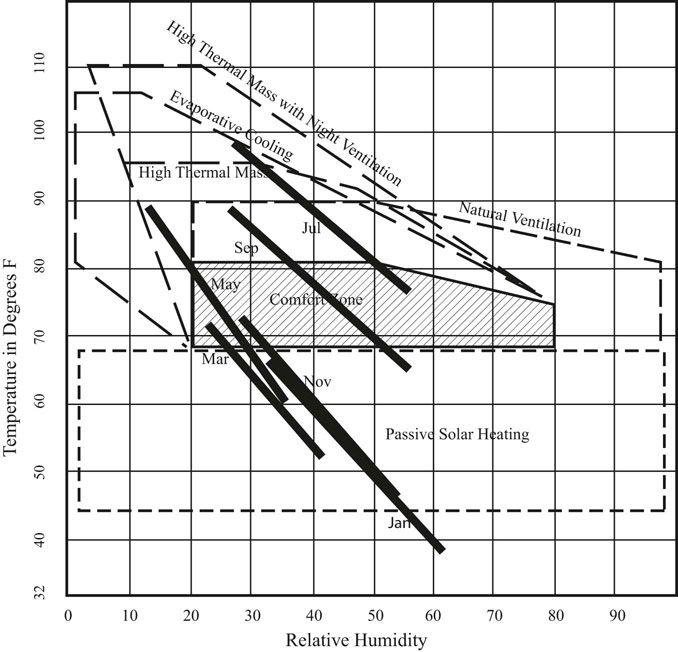
FIGURE 12.5 Tucson, Arizona, weather data plotted on the bioclimatic chart.
Source: Bioclimatic chart, Brown and DeKay 2001. Climate plot, Carl Bovill.
Honolulu provides an example of a cooling only problem. Plotting the monthly temperature and humidity conditions on the bioclimatic chart (Figure 12.7) shows all the months clustered at the humid end of the comfort zone with the daytime peak temperatures in the warmer months ascending into the cross ventilation area and the nighttime minimum temperatures descending into the mean radiant temperature zone. Comfort design in Honolulu calls for shelter from the sun and openness to the trade winds for comfort most of the year. In the colder months closing the windows and using a light blanket on the bed holds in enough body heat to provide thermal comfort.
Victor Olgyay (1963) also studied the heat loss and gain of houses in various climates. Then he correlated when, and from what direction solar gain arrives, with the cold and warm periods of the year. He used this information to provide guidance on the orientation of a house to maximize heat gain in winter and minimize heat gain in summer.
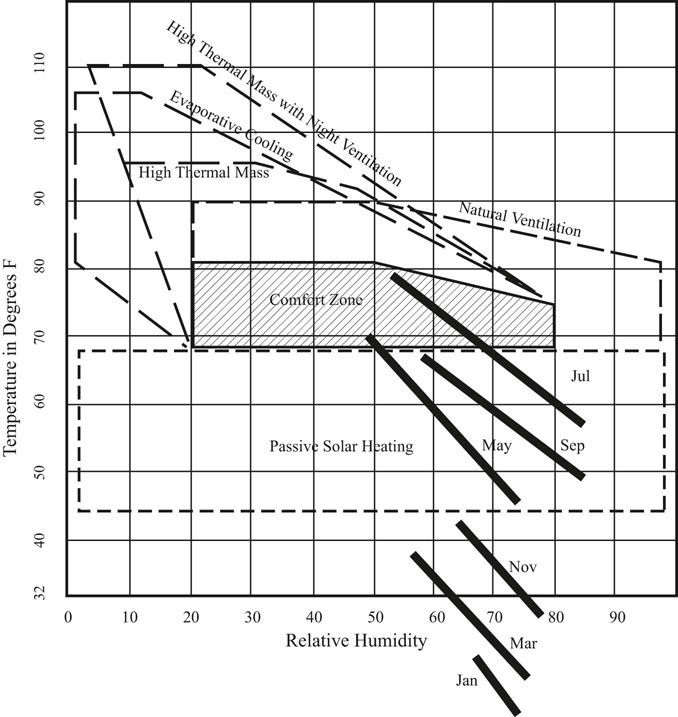
FIGURE 12.6 Burlington, Vermont, weather data plotted on the bioclimatic chart.
Source: Bioclimatic chart, Brown and DeKay 2001. Climate plot, Carl Bovill.
In the northeast, with New York as the example of a temperate climate (Figure 12.8), the center of where the sun comes from during the cold times of the year is 17 degrees east of south. The center of where the sun comes from in the warm times of the year is perpendicular, at 17 degrees south of west. Given this information a designer should aim the major side and windows of a house 17 degrees east of south into the solar gain coming during the under heated part of the year. One should also minimize the exposure of the house to solar gain coming during the overheated part of the year. The result is a rectangular shaped house oriented slightly east of south with the primary window area on this elevation and minimum window areas on the east, west, and north elevations. In cold regions, Minneapolis being the example, the recommendation is 12 degrees east of south. In hot dry regions, such as Phoenix, the recommendation is 25 degrees east of south. And in warm humid regions, such as Miami, the recommendation is 5 degrees east of south (Olgyay 1963, 58–62).
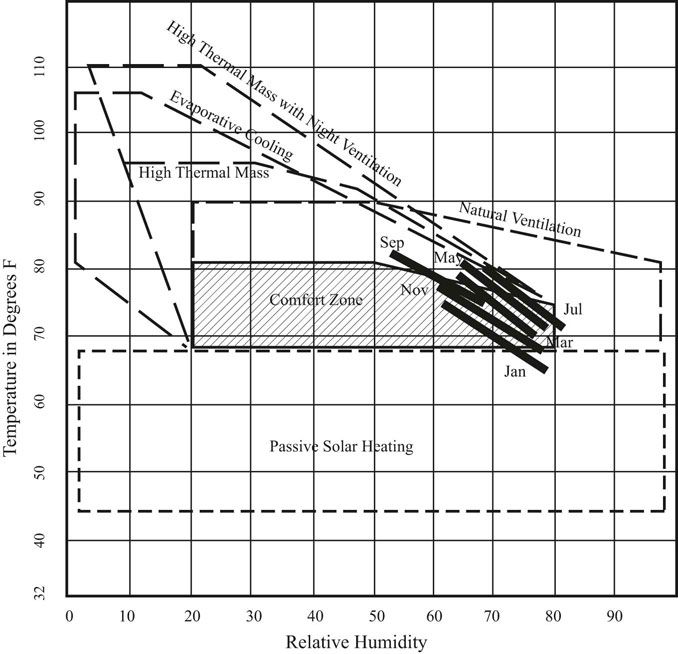
FIGURE 12.7 Honolulu, Hawaii, weather data plotted on the bioclimatic chart.
Source: Bioclimatic chart, Brown and DeKay 2001. Climate plot, Carl Bovill.
Olgyay also studied heat loss and gain in relation to shape. The balance is between a square shape having minimum exterior surface area, and thus minimum heat loss or gain, with the ability of a rectangular shape to provide more window area on the slightly east of south side with lesser windows on the east, west, and north sides. He proposed optimum shapes for cool, temperate, hot arid, and hot humid climates. They are all rectangular shapes, 1 to 1.11–1.3 for cold climates, 1 to 1.6–2.4 for temperate climates, 1 to 1.3–1.6 for hot arid climates, and 1 to 1.7–3.0 for hot humid climates (Olgyay 1963, 88–90).
I have included the numbers that Olgyay calculated for orientation and rectangular shapes to be complete and to provide context. The actual orientation angle and the shape of the rectangle is dependent on the choice of how much window area is on the dominant side and how much window area is distributed on the other orientations. The important point to remember is to orient a rectangular shaped house slightly east of south (17 to 22 degrees east of south) with the primary window area on the slightly east of south elevation.
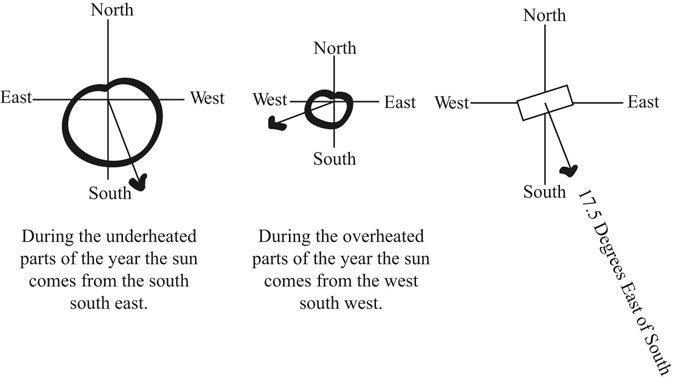
FIGURE 12.8 Deriving the optimum orientation for a house in a temperate climate as represented by New York.
Source: Olgyay, Victor. Design With Climate. Copyright 1963: Princeton University Press. 1991 renewed PUP. Reprinted by permission of Princeton University Press.

FIGURE 12.9 Comparing the thermal advantage of a bioclimatic designed house with a traditionally designed house in winter and summer.
Source: Olgyay, Victor. Design With Climate. Copyright 1963: Princeton University Press. 1991 renewed PUP. Reprinted by permission of Princeton University Press.
To demonstrate the benefit of optimum bioclimatic design, Olgyay made calculations to compare a square house with equal window areas on all sides with a bioclimatic house oriented 17 degrees east of south with most of its windows on the slightly east of south elevation (Figure 12.9). The curves on each of the elevations show heat gain when the curve is inside the house and heat loss when the curve is outside the house. In winter the sun is low in the southern sky, which provides a larger heating benefit for the bioclimatic house with more windows aimed south. In summer, the sun rises north of east, rising high in the southern sky, and sets north of west, resulting in large solar gains through east and west windows during the summer. The bioclimatic house with minimum window area on the east and west minimizes solar heat gain in the summer (Olgyay 1963, 132–137).
An additional benefit gained from bioclimatic design beyond minimizing annual energy use is solar penetration early in the morning. On any typical day during the year, the air temperature is cooler in the morning and warmer in the afternoon. A house oriented slightly east of south receives solar penetration early in the morning and avoids solar penetration in the afternoon. Orienting the kitchen, breakfast area, and master bedroom at the east end of a house maximizes the perceptual benefit of this early morning pick me up.